

Oklahoma Coronavirus Full Vaccination Rate (I:OCFV40WJ)
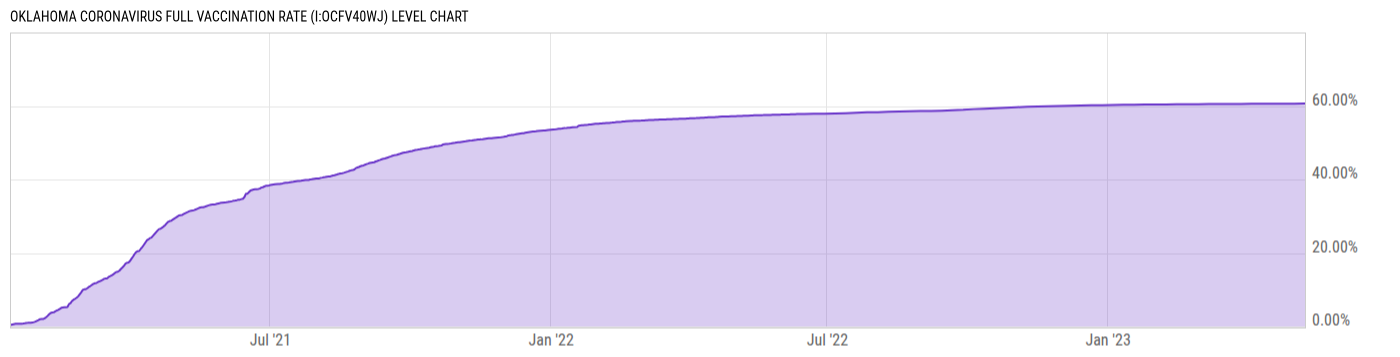
60.65% for May 10 2023
Level Chart
Basic Info
|
Oklahoma Coronavirus Full Vaccination Rate is at 60.65%, compared to 60.63% yesterday and 57.37% last year. This is higher than the long term average of 42.40%. |
| Report | Coronavirus (COVID-19) Vaccinations |
| Category | Public Health |
| Region | Oklahoma |
| Source | Our World in Data |
Stats
| Last Value | 60.65% |
| Latest Period | May 10 2023 |
| Last Updated | May 14 2023, 20:03 EDT |
| Next Release | May 21 2026, 18:00 EDT (E) |
| Long Term Average | 42.40% |
| Average Growth Rate | 352.3% |
| Value from Yesterday | 60.63% |
| Change from Yesterday | 0.03% |
| Value from 1 Year Ago | 57.37% |
| Change from 1 Year Ago | 5.72% |
| Frequency | Daily |
| Unit | Percent |
| Adjustment | N/A |
| Download Source File | |
| Notes | Includes any person that has received at least a full recommended course of Coronavirus vaccine, which may be 1 or 2 doses depending on exact vaccine received. |
Historical Data
| Date | Value |
|---|---|
| May 10, 2023 | 60.65% |
| May 03, 2023 | 60.63% |
| April 26, 2023 | 60.62% |
| April 19, 2023 | 60.61% |
| April 12, 2023 | 60.59% |
| April 05, 2023 | 60.58% |
| March 29, 2023 | 60.57% |
| March 22, 2023 | 60.52% |
| March 15, 2023 | 60.52% |
| March 08, 2023 | 60.52% |
| March 01, 2023 | 60.49% |
| February 22, 2023 | 60.48% |
| February 15, 2023 | 60.46% |
| February 08, 2023 | 60.44% |
| February 01, 2023 | 60.42% |
| January 25, 2023 | 60.40% |
| January 18, 2023 | 60.37% |
| January 11, 2023 | 60.33% |
| January 04, 2023 | 60.29% |
| December 28, 2022 | 60.22% |
| December 21, 2022 | 60.21% |
| December 14, 2022 | 60.15% |
| December 07, 2022 | 60.07% |
| November 30, 2022 | 60.01% |
| November 23, 2022 | 59.96% |
| Date | Value |
|---|---|
| November 16, 2022 | 59.87% |
| November 09, 2022 | 59.78% |
| November 02, 2022 | 59.67% |
| October 26, 2022 | 59.54% |
| October 19, 2022 | 59.40% |
| October 12, 2022 | 59.28% |
| October 05, 2022 | 59.15% |
| September 28, 2022 | 58.96% |
| September 21, 2022 | 58.84% |
| September 14, 2022 | 58.74% |
| September 07, 2022 | 58.65% |
| August 31, 2022 | 58.62% |
| August 24, 2022 | 58.56% |
| August 17, 2022 | 58.49% |
| August 10, 2022 | 58.43% |
| August 03, 2022 | 58.32% |
| July 27, 2022 | 58.27% |
| July 20, 2022 | 58.17% |
| July 13, 2022 | 58.06% |
| July 06, 2022 | 57.96% |
| June 29, 2022 | 57.90% |
| June 22, 2022 | 57.88% |
| June 16, 2022 | 57.82% |
| June 15, 2022 | 57.82% |
| June 14, 2022 | 57.80% |
News
Headline
Time (ET)
04/21 19:01
Basic Info
|
Oklahoma Coronavirus Full Vaccination Rate is at 60.65%, compared to 60.63% yesterday and 57.37% last year. This is higher than the long term average of 42.40%. |
| Report | Coronavirus (COVID-19) Vaccinations |
| Category | Public Health |
| Region | Oklahoma |
| Source | Our World in Data |
Stats
| Last Value | 60.65% |
| Latest Period | May 10 2023 |
| Last Updated | May 14 2023, 20:03 EDT |
| Next Release | May 21 2026, 18:00 EDT (E) |
| Long Term Average | 42.40% |
| Average Growth Rate | 352.3% |
| Value from Yesterday | 60.63% |
| Change from Yesterday | 0.03% |
| Value from 1 Year Ago | 57.37% |
| Change from 1 Year Ago | 5.72% |
| Frequency | Daily |
| Unit | Percent |
| Adjustment | N/A |
| Download Source File | |
| Notes | Includes any person that has received at least a full recommended course of Coronavirus vaccine, which may be 1 or 2 doses depending on exact vaccine received. |
Related Indicators
| Oklahoma Coronavirus Stats |