

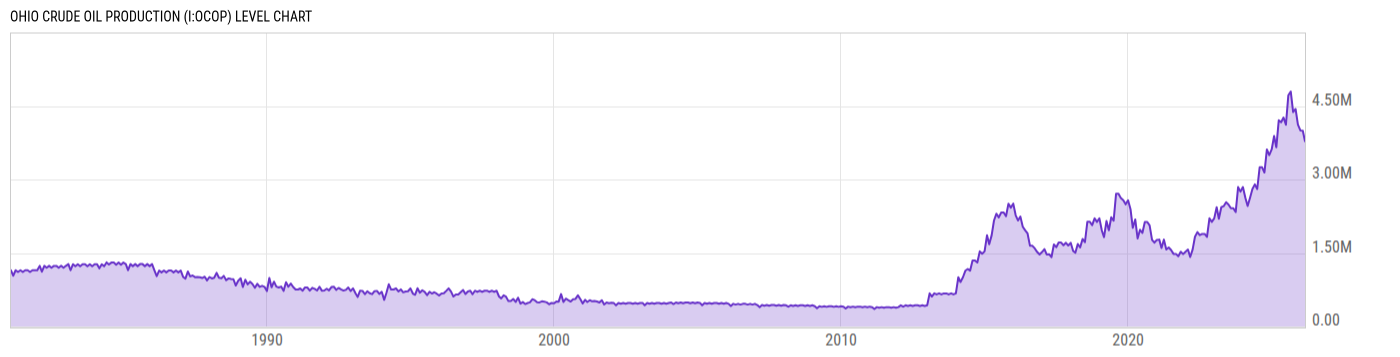
Ohio Crude Oil Production (I:OCOP)
3.782M bbl for Feb 2026
Level Chart
Basic Info
|
Ohio Crude Oil Production is at a current level of 3.782M, down from 3.995M last month and up from 3.656M one year ago. This is a change of -5.33% from last month and 3.45% from one year ago. |
| Report | Crude Oil Production |
| Category | Energy |
| Region | Ohio |
| Source | Energy Information Administration |
Stats
| Last Value | 3.782M |
| Latest Period | Feb 2026 |
| Last Updated | Apr 30 2026, 15:34 EDT |
| Next Release | May 29 2026, 15:30 EDT |
| Average Growth Rate | 6.68% |
| Value from Last Month | 3.995M |
| Change from Last Month | -5.33% |
| Value from 1 Year Ago | 3.656M |
| Change from 1 Year Ago | 3.45% |
| Frequency | Monthly |
| Unit | Barrels |
| Adjustment | N/A |
| Download Source File |
Historical Data
| Date | Value |
|---|---|
| February 28, 2026 | 3.782M |
| January 31, 2026 | 3.995M |
| December 31, 2025 | 4.001M |
| November 30, 2025 | 4.118M |
| October 31, 2025 | 4.44M |
| September 30, 2025 | 4.377M |
| August 31, 2025 | 4.794M |
| July 31, 2025 | 4.72M |
| June 30, 2025 | 4.116M |
| May 31, 2025 | 4.265M |
| April 30, 2025 | 4.168M |
| March 31, 2025 | 4.208M |
| February 28, 2025 | 3.656M |
| January 31, 2025 | 3.888M |
| December 31, 2024 | 3.613M |
| November 30, 2024 | 3.496M |
| October 31, 2024 | 3.613M |
| September 30, 2024 | 3.143M |
| August 31, 2024 | 3.248M |
| July 31, 2024 | 3.248M |
| June 30, 2024 | 2.806M |
| May 31, 2024 | 2.90M |
| April 30, 2024 | 2.806M |
| March 31, 2024 | 2.629M |
| February 29, 2024 | 2.46M |
| Date | Value |
|---|---|
| January 31, 2024 | 2.629M |
| December 31, 2023 | 2.845M |
| November 30, 2023 | 2.753M |
| October 31, 2023 | 2.845M |
| September 30, 2023 | 2.336M |
| August 31, 2023 | 2.414M |
| July 31, 2023 | 2.414M |
| June 30, 2023 | 2.491M |
| May 31, 2023 | 2.537M |
| April 30, 2023 | 2.455M |
| March 31, 2023 | 2.433M |
| February 28, 2023 | 2.198M |
| January 31, 2023 | 2.433M |
| December 31, 2022 | 2.207M |
| November 30, 2022 | 2.136M |
| October 31, 2022 | 2.207M |
| September 30, 2022 | 1.828M |
| August 31, 2022 | 1.889M |
| July 31, 2022 | 1.889M |
| June 30, 2022 | 1.864M |
| May 31, 2022 | 1.926M |
| April 30, 2022 | 1.831M |
| March 31, 2022 | 1.57M |
| February 28, 2022 | 1.418M |
| January 31, 2022 | 1.57M |
News
Headline
Time (ET)
05/13 14:39
05/06 06:06
05/05 05:55
04/28 05:55
Basic Info
|
Ohio Crude Oil Production is at a current level of 3.782M, down from 3.995M last month and up from 3.656M one year ago. This is a change of -5.33% from last month and 3.45% from one year ago. |
| Report | Crude Oil Production |
| Category | Energy |
| Region | Ohio |
| Source | Energy Information Administration |
Stats
| Last Value | 3.782M |
| Latest Period | Feb 2026 |
| Last Updated | Apr 30 2026, 15:34 EDT |
| Next Release | May 29 2026, 15:30 EDT |
| Average Growth Rate | 6.68% |
| Value from Last Month | 3.995M |
| Change from Last Month | -5.33% |
| Value from 1 Year Ago | 3.656M |
| Change from 1 Year Ago | 3.45% |
| Frequency | Monthly |
| Unit | Barrels |
| Adjustment | N/A |
| Download Source File |