

Nova Scotia Wholesale Sales (I:NSWS)
1.326B CAD for Dec 2024
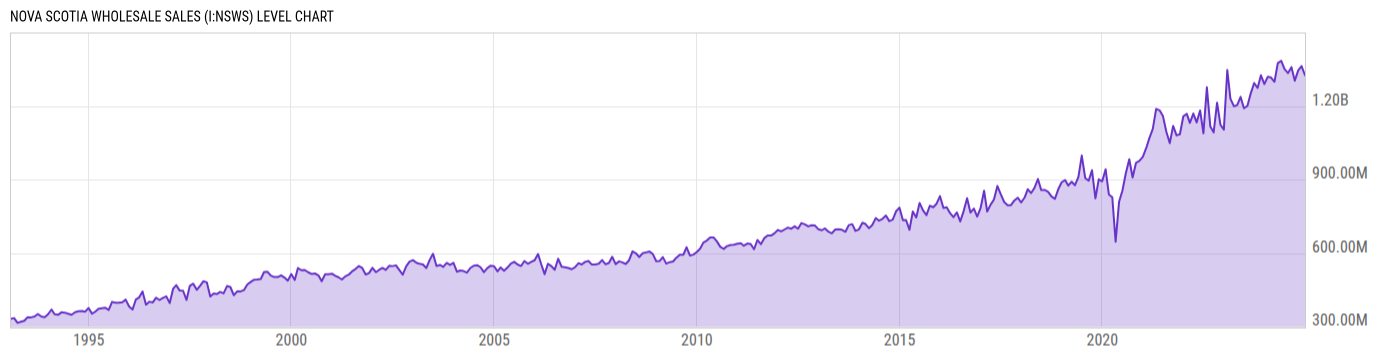
Level Chart
Basic Info
|
Nova Scotia Wholesale Sales is at a current level of 1.326B, down from 1.363B last month and up from 1.290B one year ago. This is a change of -2.72% from last month and 2.81% from one year ago. |
| Report | Canada Wholesale Trade |
| Category | Retail and Services Business Statistics |
| Region | Nova Scotia |
| Source | Statistics Canada |
Stats
| Last Value | 1.326B |
| Latest Period | Dec 2024 |
| Last Updated | Dec 12 2025, 08:32 EST |
| Next Release | Jun 15 2026, 08:30 EDT |
| Average Growth Rate | 5.58% |
| Value from Last Month | 1.363B |
| Change from Last Month | -2.72% |
| Value from 1 Year Ago | 1.290B |
| Change from 1 Year Ago | 2.81% |
| Frequency | Monthly |
| Unit | CAD |
| Adjustment | Seasonally Adjusted |
| Download Source File |
Historical Data
| Date | Value |
|---|---|
| December 31, 2024 | 1.326B |
| November 30, 2024 | 1.363B |
| October 31, 2024 | 1.346B |
| September 30, 2024 | 1.303B |
| August 31, 2024 | 1.359B |
| July 31, 2024 | 1.334B |
| June 30, 2024 | 1.350B |
| May 31, 2024 | 1.384B |
| April 30, 2024 | 1.375B |
| March 31, 2024 | 1.299B |
| February 29, 2024 | 1.316B |
| January 31, 2024 | 1.320B |
| December 31, 2023 | 1.290B |
| November 30, 2023 | 1.325B |
| October 31, 2023 | 1.274B |
| September 30, 2023 | 1.294B |
| August 31, 2023 | 1.253B |
| July 31, 2023 | 1.200B |
| June 30, 2023 | 1.191B |
| May 31, 2023 | 1.237B |
| April 30, 2023 | 1.203B |
| March 31, 2023 | 1.199B |
| February 28, 2023 | 1.230B |
| January 31, 2023 | 1.347B |
| December 31, 2022 | 1.103B |
| Date | Value |
|---|---|
| November 30, 2022 | 1.124B |
| October 31, 2022 | 1.214B |
| September 30, 2022 | 1.092B |
| August 31, 2022 | 1.116B |
| July 31, 2022 | 1.276B |
| June 30, 2022 | 1.089B |
| May 31, 2022 | 1.182B |
| April 30, 2022 | 1.133B |
| March 31, 2022 | 1.169B |
| February 28, 2022 | 1.131B |
| January 31, 2022 | 1.168B |
| December 31, 2021 | 1.158B |
| November 30, 2021 | 1.085B |
| October 31, 2021 | 1.080B |
| September 30, 2021 | 1.119B |
| August 31, 2021 | 1.049B |
| July 31, 2021 | 1.095B |
| June 30, 2021 | 1.160B |
| May 31, 2021 | 1.182B |
| April 30, 2021 | 1.188B |
| March 31, 2021 | 1.107B |
| February 28, 2021 | 1.069B |
| January 31, 2021 | 1.029B |
| December 31, 2020 | 992.60M |
| November 30, 2020 | 975.94M |
News
Headline
Time (ET)
06/09 07:58
05/14 07:39
Basic Info
|
Nova Scotia Wholesale Sales is at a current level of 1.326B, down from 1.363B last month and up from 1.290B one year ago. This is a change of -2.72% from last month and 2.81% from one year ago. |
| Report | Canada Wholesale Trade |
| Category | Retail and Services Business Statistics |
| Region | Nova Scotia |
| Source | Statistics Canada |
Stats
| Last Value | 1.326B |
| Latest Period | Dec 2024 |
| Last Updated | Dec 12 2025, 08:32 EST |
| Next Release | Jun 15 2026, 08:30 EDT |
| Average Growth Rate | 5.58% |
| Value from Last Month | 1.363B |
| Change from Last Month | -2.72% |
| Value from 1 Year Ago | 1.290B |
| Change from 1 Year Ago | 2.81% |
| Frequency | Monthly |
| Unit | CAD |
| Adjustment | Seasonally Adjusted |
| Download Source File |