

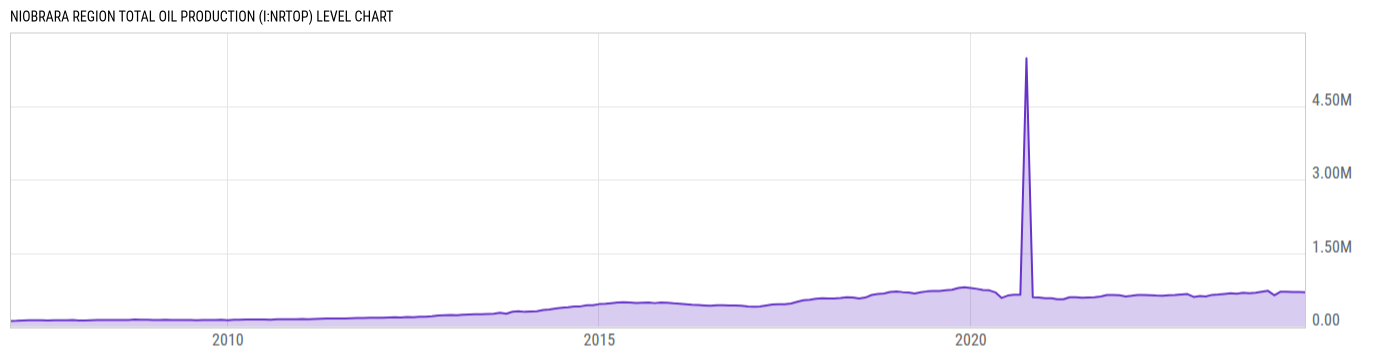
Niobrara Region Total Oil Production (I:NRTOP)
696625.8 bbl/d for Jun 2024
Level Chart
Basic Info
|
Niobrara Region Total Oil Production is at a current level of 696625.8, down from 701690.1 last month and up from 678994.6 one year ago. This is a change of -0.72% from last month and 2.60% from one year ago. |
| Report | Drilling Productivity Report |
| Category | Energy |
| Region | N/A |
| Source | Energy Information Administration |
Stats
| Last Value | 696625.8 |
| Latest Period | Jun 2024 |
| Last Updated | May 13 2024, 15:32 EDT |
| Next Release | Jun 9 2026, 15:30 EDT |
| Average Growth Rate | 49.25% |
| Value from Last Month | 701690.1 |
| Change from Last Month | -0.72% |
| Value from 1 Year Ago | 678994.6 |
| Change from 1 Year Ago | 2.60% |
| Frequency | Monthly |
| Unit | Barrels per Day |
| Adjustment | N/A |
| Download Source File |
Historical Data
| Date | Value |
|---|---|
| June 30, 2024 | 696625.8 |
| May 31, 2024 | 701690.1 |
| April 30, 2024 | 705115.2 |
| March 31, 2024 | 708391.3 |
| February 29, 2024 | 707652.2 |
| January 31, 2024 | 637125.0 |
| December 31, 2023 | 728336.6 |
| November 30, 2023 | 707544.8 |
| October 31, 2023 | 688486.1 |
| September 30, 2023 | 677334.8 |
| August 31, 2023 | 687691.6 |
| July 31, 2023 | 669987.6 |
| June 30, 2023 | 678994.6 |
| May 31, 2023 | 665126.7 |
| April 30, 2023 | 651741.9 |
| March 31, 2023 | 645128.8 |
| February 28, 2023 | 611855.8 |
| January 31, 2023 | 623505.8 |
| December 31, 2022 | 604303.6 |
| November 30, 2022 | 661619.0 |
| October 31, 2022 | 651136.5 |
| September 30, 2022 | 640657.4 |
| August 31, 2022 | 638817.9 |
| July 31, 2022 | 628914.7 |
| June 30, 2022 | 630187.9 |
| Date | Value |
|---|---|
| May 31, 2022 | 638539.6 |
| April 30, 2022 | 643178.8 |
| March 31, 2022 | 642159.2 |
| February 28, 2022 | 625594.7 |
| January 31, 2022 | 613245.2 |
| December 31, 2021 | 636526.4 |
| November 30, 2021 | 641041.0 |
| October 31, 2021 | 642039.5 |
| September 30, 2021 | 612197.9 |
| August 31, 2021 | 596918.0 |
| July 31, 2021 | 591185.0 |
| June 30, 2021 | 585349.3 |
| May 31, 2021 | 597110.8 |
| April 30, 2021 | 597150.8 |
| March 31, 2021 | 555608.0 |
| February 28, 2021 | 557246.7 |
| January 31, 2021 | 574493.4 |
| December 31, 2020 | 577854.9 |
| November 30, 2020 | 590541.9 |
| October 31, 2020 | 596193.0 |
| September 30, 2020 | 5.473M |
| August 31, 2020 | 649597.4 |
| July 31, 2020 | 648055.6 |
| June 30, 2020 | 630635.6 |
| May 31, 2020 | 583872.4 |
News
Headline
Time (ET)
Basic Info
|
Niobrara Region Total Oil Production is at a current level of 696625.8, down from 701690.1 last month and up from 678994.6 one year ago. This is a change of -0.72% from last month and 2.60% from one year ago. |
| Report | Drilling Productivity Report |
| Category | Energy |
| Region | N/A |
| Source | Energy Information Administration |
Stats
| Last Value | 696625.8 |
| Latest Period | Jun 2024 |
| Last Updated | May 13 2024, 15:32 EDT |
| Next Release | Jun 9 2026, 15:30 EDT |
| Average Growth Rate | 49.25% |
| Value from Last Month | 701690.1 |
| Change from Last Month | -0.72% |
| Value from 1 Year Ago | 678994.6 |
| Change from 1 Year Ago | 2.60% |
| Frequency | Monthly |
| Unit | Barrels per Day |
| Adjustment | N/A |
| Download Source File |