

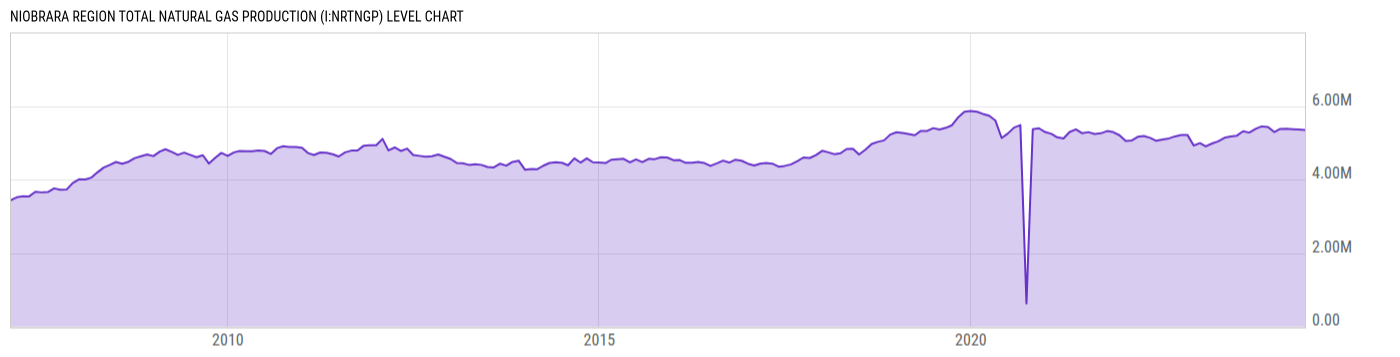
Niobrara Region Total Natural Gas Production (I:NRTNGP)
5.344M cf/d for Jun 2024
Level Chart
Basic Info
|
Niobrara Region Total Natural Gas Production is at a current level of 5.344M, down from 5.359M last month and up from 5.167M one year ago. This is a change of -0.28% from last month and 3.41% from one year ago. |
| Report | Drilling Productivity Report |
| Category | Energy |
| Region | N/A |
| Source | Energy Information Administration |
Stats
| Last Value | 5.344M |
| Latest Period | Jun 2024 |
| Last Updated | May 13 2024, 15:32 EDT |
| Next Release | Jun 9 2026, 15:30 EDT |
| Average Growth Rate | 41.29% |
| Value from Last Month | 5.359M |
| Change from Last Month | -0.28% |
| Value from 1 Year Ago | 5.167M |
| Change from 1 Year Ago | 3.41% |
| Frequency | Monthly |
| Unit | Cubic Feet per Day |
| Adjustment | N/A |
| Download Source File |
Historical Data
| Date | Value |
|---|---|
| June 30, 2024 | 5.344M |
| May 31, 2024 | 5.359M |
| April 30, 2024 | 5.369M |
| March 31, 2024 | 5.380M |
| February 29, 2024 | 5.377M |
| January 31, 2024 | 5.292M |
| December 31, 2023 | 5.429M |
| November 30, 2023 | 5.444M |
| October 31, 2023 | 5.378M |
| September 30, 2023 | 5.276M |
| August 31, 2023 | 5.312M |
| July 31, 2023 | 5.192M |
| June 30, 2023 | 5.167M |
| May 31, 2023 | 5.135M |
| April 30, 2023 | 5.037M |
| March 31, 2023 | 4.980M |
| February 28, 2023 | 4.900M |
| January 31, 2023 | 4.989M |
| December 31, 2022 | 4.924M |
| November 30, 2022 | 5.214M |
| October 31, 2022 | 5.210M |
| September 30, 2022 | 5.173M |
| August 31, 2022 | 5.118M |
| July 31, 2022 | 5.090M |
| June 30, 2022 | 5.053M |
| Date | Value |
|---|---|
| May 31, 2022 | 5.132M |
| April 30, 2022 | 5.183M |
| March 31, 2022 | 5.162M |
| February 28, 2022 | 5.059M |
| January 31, 2022 | 5.050M |
| December 31, 2021 | 5.204M |
| November 30, 2021 | 5.290M |
| October 31, 2021 | 5.318M |
| September 30, 2021 | 5.256M |
| August 31, 2021 | 5.240M |
| July 31, 2021 | 5.289M |
| June 30, 2021 | 5.260M |
| May 31, 2021 | 5.365M |
| April 30, 2021 | 5.292M |
| March 31, 2021 | 5.117M |
| February 28, 2021 | 5.148M |
| January 31, 2021 | 5.241M |
| December 31, 2020 | 5.291M |
| November 30, 2020 | 5.394M |
| October 31, 2020 | 5.368M |
| September 30, 2020 | 625806.9 |
| August 31, 2020 | 5.479M |
| July 31, 2020 | 5.412M |
| June 30, 2020 | 5.248M |
| May 31, 2020 | 5.129M |
News
Headline
Time (ET)
Basic Info
|
Niobrara Region Total Natural Gas Production is at a current level of 5.344M, down from 5.359M last month and up from 5.167M one year ago. This is a change of -0.28% from last month and 3.41% from one year ago. |
| Report | Drilling Productivity Report |
| Category | Energy |
| Region | N/A |
| Source | Energy Information Administration |
Stats
| Last Value | 5.344M |
| Latest Period | Jun 2024 |
| Last Updated | May 13 2024, 15:32 EDT |
| Next Release | Jun 9 2026, 15:30 EDT |
| Average Growth Rate | 41.29% |
| Value from Last Month | 5.359M |
| Change from Last Month | -0.28% |
| Value from 1 Year Ago | 5.167M |
| Change from 1 Year Ago | 3.41% |
| Frequency | Monthly |
| Unit | Cubic Feet per Day |
| Adjustment | N/A |
| Download Source File |