

Nextera Energy Inc (NEE) - FPL Net Income Attributable to NEE (DISCONTINUED) (I:NEINEENY)
Level Chart
Basic Info
|
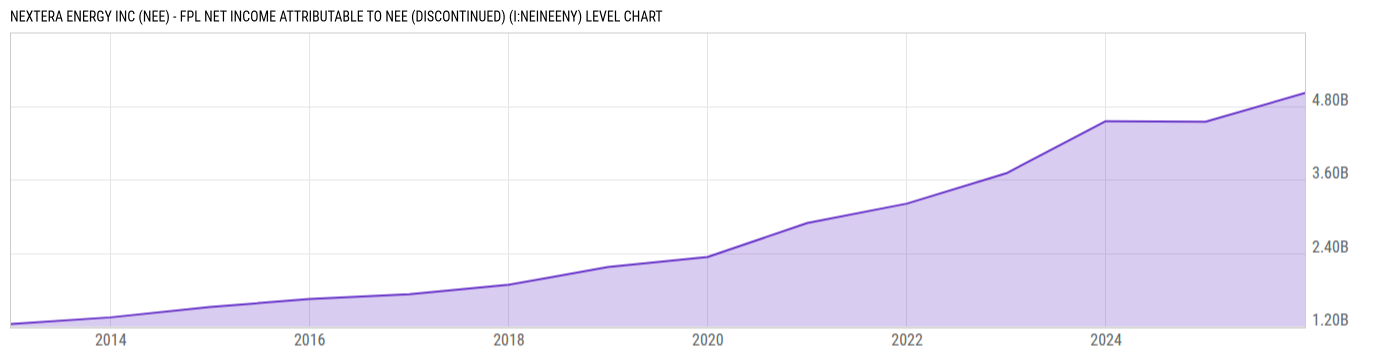
Nextera Energy Inc (NEE) - FPL Net Income Attributable to NEE is at a current level of 5.012B, up from 4.543B one year ago. This is a change of 10.32% from one year ago. |
|
Nextera Energy Inc FPL Net Income Attributable to NEE represents the profit earned by NextEra Energy, Inc. as a whole, which includes all of its operations and subsidiaries, with Florida Power & Light Company (FPL) being a significant contributor to this figure. |
| Report | Fiscal.ai |
| Category | Segments & KPIs |
| Region | United States |
| Source | Fiscal.ai |
|
Data provided via Fiscal.ai |
Stats
| Last Value | 5.012B |
| Latest Period | 2025 |
| Last Updated | Jan 31 2026, 08:31 EST |
| Average Growth Rate | 11.53% |
| Value from 1 Year Ago | 4.543B |
| Change from 1 Year Ago | 10.32% |
| Frequency | Yearly |
| Unit | USD |
| Adjustment | N/A |
| Download Source File |
Historical Data
| Date | Value |
|---|---|
| December 31, 2025 | 5.012B |
| December 31, 2024 | 4.543B |
| December 31, 2023 | 4.552B |
| December 31, 2022 | 3.701B |
| December 31, 2021 | 3.206B |
| December 31, 2020 | 2.89B |
| December 31, 2019 | 2.334B |
| Date | Value |
|---|---|
| December 31, 2018 | 2.171B |
| December 31, 2017 | 1.88B |
| December 31, 2016 | 1.727B |
| December 31, 2015 | 1.648B |
| December 31, 2014 | 1.517B |
| December 31, 2013 | 1.349B |
| December 31, 2012 | 1.24B |
News
Basic Info
|
Nextera Energy Inc (NEE) - FPL Net Income Attributable to NEE is at a current level of 5.012B, up from 4.543B one year ago. This is a change of 10.32% from one year ago. |
|
Nextera Energy Inc FPL Net Income Attributable to NEE represents the profit earned by NextEra Energy, Inc. as a whole, which includes all of its operations and subsidiaries, with Florida Power & Light Company (FPL) being a significant contributor to this figure. |
| Report | Fiscal.ai |
| Category | Segments & KPIs |
| Region | United States |
| Source | Fiscal.ai |
|
Data provided via Fiscal.ai |
Stats
| Last Value | 5.012B |
| Latest Period | 2025 |
| Last Updated | Jan 31 2026, 08:31 EST |
| Average Growth Rate | 11.53% |
| Value from 1 Year Ago | 4.543B |
| Change from 1 Year Ago | 10.32% |
| Frequency | Yearly |
| Unit | USD |
| Adjustment | N/A |
| Download Source File |