

New Hampshire House Price All-Transactions Index (I:NHHPI)
906.43 for Q1 2026
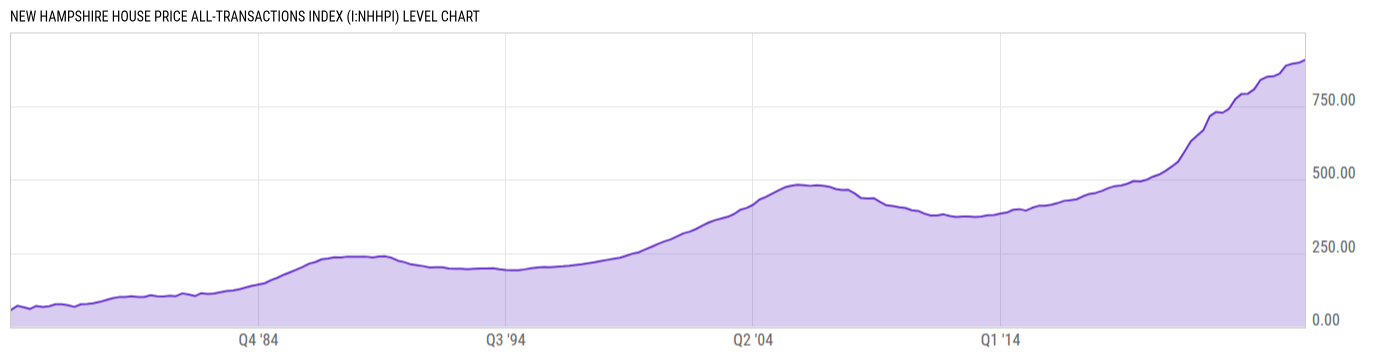
Level Chart
Basic Info
|
New Hampshire House Price All-Transactions Index is at a current level of 906.43, up from 896.89 last quarter and up from 860.42 one year ago. This is a change of 1.06% from last quarter and 5.35% from one year ago. |
| Report | FHFA House Price Index |
| Category | House Prices |
| Region | New Hampshire |
| Source | Federal Housing Finance Agency |
Stats
| Last Value | 906.43 |
| Latest Period | Mar 2026 |
| Last Updated | May 26 2026, 09:12 EDT |
| Next Release | Aug 25 2026, 09:00 EDT |
| Average Growth Rate | 5.72% |
| Value from Last Quarter | 896.89 |
| Change from Last Quarter | 1.06% |
| Value from 1 Year Ago | 860.42 |
| Change from 1 Year Ago | 5.35% |
| Frequency | Quarterly |
| Unit | Index Q1 1991=100 |
| Adjustment | Not Seasonally Adjusted |
| Download Source File |
Historical Data
| Date | Value |
|---|---|
| March 31, 2026 | 906.43 |
| December 31, 2025 | 896.89 |
| September 30, 2025 | 893.73 |
| June 30, 2025 | 887.24 |
| March 31, 2025 | 860.42 |
| December 31, 2024 | 850.82 |
| September 30, 2024 | 849.26 |
| June 30, 2024 | 839.12 |
| March 31, 2024 | 807.59 |
| December 31, 2023 | 791.94 |
| September 30, 2023 | 791.22 |
| June 30, 2023 | 772.58 |
| March 31, 2023 | 739.95 |
| December 31, 2022 | 727.10 |
| September 30, 2022 | 729.81 |
| June 30, 2022 | 715.39 |
| March 31, 2022 | 668.64 |
| December 31, 2021 | 649.42 |
| September 30, 2021 | 630.17 |
| June 30, 2021 | 594.65 |
| March 31, 2021 | 560.82 |
| December 31, 2020 | 544.45 |
| September 30, 2020 | 529.18 |
| June 30, 2020 | 516.93 |
| March 31, 2020 | 509.47 |
| Date | Value |
|---|---|
| December 31, 2019 | 498.93 |
| September 30, 2019 | 493.03 |
| June 30, 2019 | 494.82 |
| March 31, 2019 | 485.64 |
| December 31, 2018 | 479.79 |
| September 30, 2018 | 477.35 |
| June 30, 2018 | 470.66 |
| March 31, 2018 | 461.38 |
| December 31, 2017 | 454.41 |
| September 30, 2017 | 450.93 |
| June 30, 2017 | 442.92 |
| March 31, 2017 | 432.75 |
| December 31, 2016 | 429.82 |
| September 30, 2016 | 427.30 |
| June 30, 2016 | 419.77 |
| March 31, 2016 | 414.06 |
| December 31, 2015 | 410.51 |
| September 30, 2015 | 410.36 |
| June 30, 2015 | 403.68 |
| March 31, 2015 | 394.20 |
| December 31, 2014 | 399.18 |
| September 30, 2014 | 397.01 |
| June 30, 2014 | 387.42 |
| March 31, 2014 | 384.20 |
| December 31, 2013 | 379.54 |
News
Headline
Time (ET)
05/28 12:00
05/15 07:05
05/14 12:00
05/14 07:24
05/08 12:34
05/07 12:00
Basic Info
|
New Hampshire House Price All-Transactions Index is at a current level of 906.43, up from 896.89 last quarter and up from 860.42 one year ago. This is a change of 1.06% from last quarter and 5.35% from one year ago. |
| Report | FHFA House Price Index |
| Category | House Prices |
| Region | New Hampshire |
| Source | Federal Housing Finance Agency |
Stats
| Last Value | 906.43 |
| Latest Period | Mar 2026 |
| Last Updated | May 26 2026, 09:12 EDT |
| Next Release | Aug 25 2026, 09:00 EDT |
| Average Growth Rate | 5.72% |
| Value from Last Quarter | 896.89 |
| Change from Last Quarter | 1.06% |
| Value from 1 Year Ago | 860.42 |
| Change from 1 Year Ago | 5.35% |
| Frequency | Quarterly |
| Unit | Index Q1 1991=100 |
| Adjustment | Not Seasonally Adjusted |
| Download Source File |