

New England Census Division House Price Index (I:NECDHPSM)
448.67 for Mar 2026
Level Chart
Basic Info
|
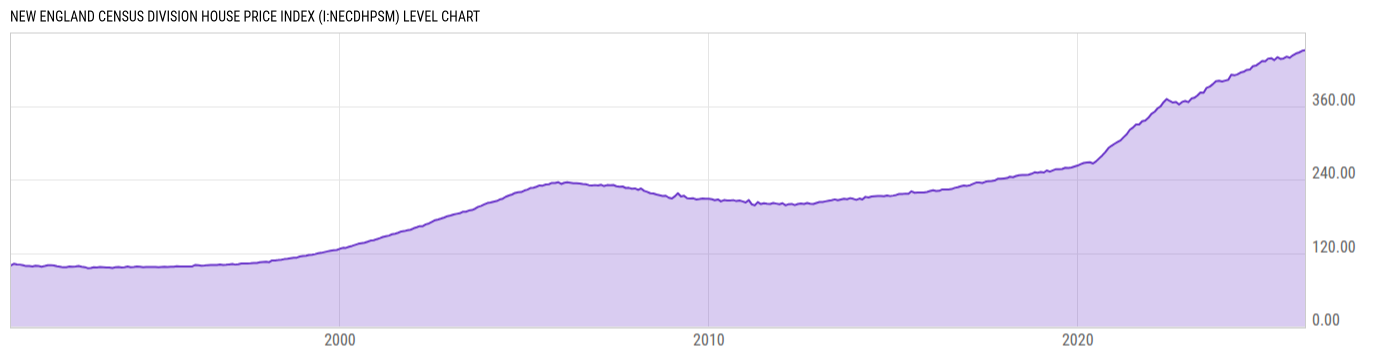
New England Census Division House Price Index is at a current level of 448.67, down from 452.00 last month and up from 437.73 one year ago. This is a change of -0.74% from last month and 2.50% from one year ago. |
| Report | FHFA House Price Index |
| Category | House Prices |
| Region | United States |
| Source | Federal Housing Finance Agency |
Stats
| Last Value | 448.67 |
| Latest Period | Mar 2026 |
| Last Updated | May 26 2026, 09:02 EDT |
| Next Release | Jun 30 2026, 09:00 EDT |
| Average Growth Rate | 4.32% |
| Value from Last Month | 452.00 |
| Change from Last Month | -0.74% |
| Value from 1 Year Ago | 437.73 |
| Change from 1 Year Ago | 2.50% |
| Frequency | Monthly |
| Unit | Index January 1991=100 |
| Adjustment | Seasonally Adjusted |
| Download Source File |
Historical Data
| Date | Value |
|---|---|
| March 31, 2026 | 448.67 |
| February 28, 2026 | 452.00 |
| January 31, 2026 | 449.72 |
| December 31, 2025 | 447.52 |
| November 30, 2025 | 445.97 |
| October 31, 2025 | 442.83 |
| September 30, 2025 | 438.99 |
| August 31, 2025 | 440.56 |
| July 31, 2025 | 437.18 |
| June 30, 2025 | 436.89 |
| May 31, 2025 | 439.15 |
| April 30, 2025 | 434.82 |
| March 31, 2025 | 437.73 |
| February 28, 2025 | 437.10 |
| January 31, 2025 | 433.00 |
| December 31, 2024 | 433.36 |
| November 30, 2024 | 429.47 |
| October 31, 2024 | 425.93 |
| September 30, 2024 | 424.95 |
| August 31, 2024 | 419.83 |
| July 31, 2024 | 418.99 |
| June 30, 2024 | 415.70 |
| May 31, 2024 | 414.58 |
| April 30, 2024 | 411.43 |
| March 31, 2024 | 409.92 |
| Date | Value |
|---|---|
| February 29, 2024 | 411.14 |
| January 31, 2024 | 402.89 |
| December 31, 2023 | 401.48 |
| November 30, 2023 | 399.94 |
| October 31, 2023 | 401.09 |
| September 30, 2023 | 400.49 |
| August 31, 2023 | 395.74 |
| July 31, 2023 | 391.63 |
| June 30, 2023 | 389.69 |
| May 31, 2023 | 381.56 |
| April 30, 2023 | 382.13 |
| March 31, 2023 | 377.04 |
| February 28, 2023 | 373.36 |
| January 31, 2023 | 372.15 |
| December 31, 2022 | 366.30 |
| November 30, 2022 | 368.23 |
| October 31, 2022 | 366.67 |
| September 30, 2022 | 362.47 |
| August 31, 2022 | 366.56 |
| July 31, 2022 | 365.60 |
| June 30, 2022 | 368.21 |
| May 31, 2022 | 371.35 |
| April 30, 2022 | 366.20 |
| March 31, 2022 | 359.40 |
| February 28, 2022 | 355.90 |
News
Headline
Time (ET)
06/03 07:13
05/28 12:00
05/15 07:05
05/14 12:00
05/14 07:24
05/07 12:00
Basic Info
|
New England Census Division House Price Index is at a current level of 448.67, down from 452.00 last month and up from 437.73 one year ago. This is a change of -0.74% from last month and 2.50% from one year ago. |
| Report | FHFA House Price Index |
| Category | House Prices |
| Region | United States |
| Source | Federal Housing Finance Agency |
Stats
| Last Value | 448.67 |
| Latest Period | Mar 2026 |
| Last Updated | May 26 2026, 09:02 EDT |
| Next Release | Jun 30 2026, 09:00 EDT |
| Average Growth Rate | 4.32% |
| Value from Last Month | 452.00 |
| Change from Last Month | -0.74% |
| Value from 1 Year Ago | 437.73 |
| Change from 1 Year Ago | 2.50% |
| Frequency | Monthly |
| Unit | Index January 1991=100 |
| Adjustment | Seasonally Adjusted |
| Download Source File |