

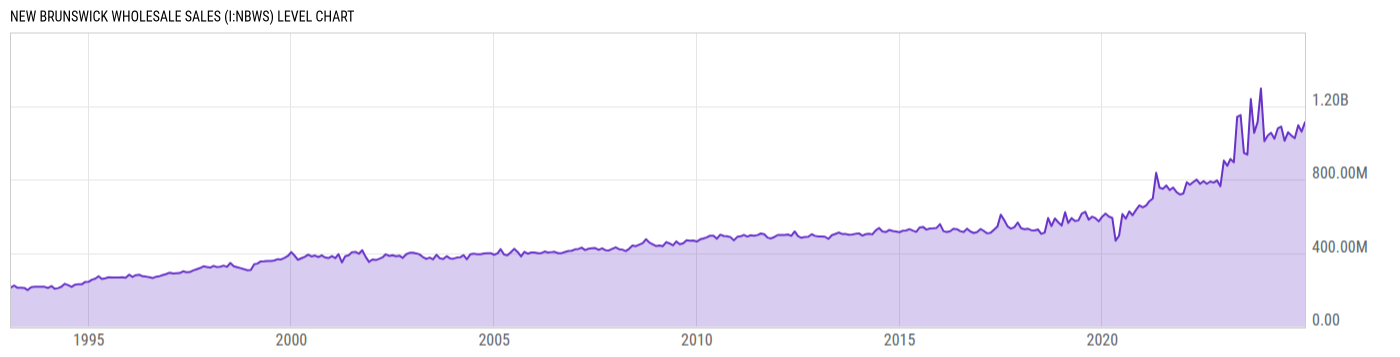
New Brunswick Wholesale Sales (I:NBWS)
1.112B CAD for Dec 2024
Level Chart
Basic Info
|
New Brunswick Wholesale Sales is at a current level of 1.112B, up from 1.060B last month and up from 1.008B one year ago. This is a change of 4.83% from last month and 10.24% from one year ago. |
| Report | Canada Wholesale Trade |
| Category | Retail and Services Business Statistics |
| Region | New Brunswick |
| Source | Statistics Canada |
Stats
| Last Value | 1.112B |
| Latest Period | Dec 2024 |
| Last Updated | Dec 12 2025, 08:33 EST |
| Next Release | Jun 15 2026, 08:30 EDT |
| Average Growth Rate | 6.60% |
| Value from Last Month | 1.060B |
| Change from Last Month | 4.83% |
| Value from 1 Year Ago | 1.008B |
| Change from 1 Year Ago | 10.24% |
| Frequency | Monthly |
| Unit | CAD |
| Adjustment | Seasonally Adjusted |
| Download Source File |
Historical Data
| Date | Value |
|---|---|
| December 31, 2024 | 1.112B |
| November 30, 2024 | 1.060B |
| October 31, 2024 | 1.096B |
| September 30, 2024 | 1.025B |
| August 31, 2024 | 1.039B |
| July 31, 2024 | 1.057B |
| June 30, 2024 | 1.011B |
| May 31, 2024 | 1.088B |
| April 30, 2024 | 1.078B |
| March 31, 2024 | 1.022B |
| February 29, 2024 | 1.054B |
| January 31, 2024 | 1.040B |
| December 31, 2023 | 1.008B |
| November 30, 2023 | 1.295B |
| October 31, 2023 | 1.112B |
| September 30, 2023 | 1.054B |
| August 31, 2023 | 1.238B |
| July 31, 2023 | 935.41M |
| June 30, 2023 | 944.55M |
| May 31, 2023 | 1.151B |
| April 30, 2023 | 1.141B |
| March 31, 2023 | 893.00M |
| February 28, 2023 | 911.57M |
| January 31, 2023 | 874.52M |
| December 31, 2022 | 902.71M |
| Date | Value |
|---|---|
| November 30, 2022 | 763.43M |
| October 31, 2022 | 795.00M |
| September 30, 2022 | 783.15M |
| August 31, 2022 | 789.26M |
| July 31, 2022 | 776.75M |
| June 30, 2022 | 790.93M |
| May 31, 2022 | 776.41M |
| April 30, 2022 | 799.58M |
| March 31, 2022 | 786.62M |
| February 28, 2022 | 771.01M |
| January 31, 2022 | 785.30M |
| December 31, 2021 | 723.92M |
| November 30, 2021 | 718.55M |
| October 31, 2021 | 730.95M |
| September 30, 2021 | 756.31M |
| August 31, 2021 | 742.66M |
| July 31, 2021 | 767.11M |
| June 30, 2021 | 749.90M |
| May 31, 2021 | 754.75M |
| April 30, 2021 | 836.44M |
| March 31, 2021 | 697.06M |
| February 28, 2021 | 681.96M |
| January 31, 2021 | 659.26M |
| December 31, 2020 | 648.41M |
| November 30, 2020 | 658.98M |
News
Headline
Time (ET)
06/09 07:58
05/14 07:39
Basic Info
|
New Brunswick Wholesale Sales is at a current level of 1.112B, up from 1.060B last month and up from 1.008B one year ago. This is a change of 4.83% from last month and 10.24% from one year ago. |
| Report | Canada Wholesale Trade |
| Category | Retail and Services Business Statistics |
| Region | New Brunswick |
| Source | Statistics Canada |
Stats
| Last Value | 1.112B |
| Latest Period | Dec 2024 |
| Last Updated | Dec 12 2025, 08:33 EST |
| Next Release | Jun 15 2026, 08:30 EDT |
| Average Growth Rate | 6.60% |
| Value from Last Month | 1.060B |
| Change from Last Month | 4.83% |
| Value from 1 Year Ago | 1.008B |
| Change from 1 Year Ago | 10.24% |
| Frequency | Monthly |
| Unit | CAD |
| Adjustment | Seasonally Adjusted |
| Download Source File |