

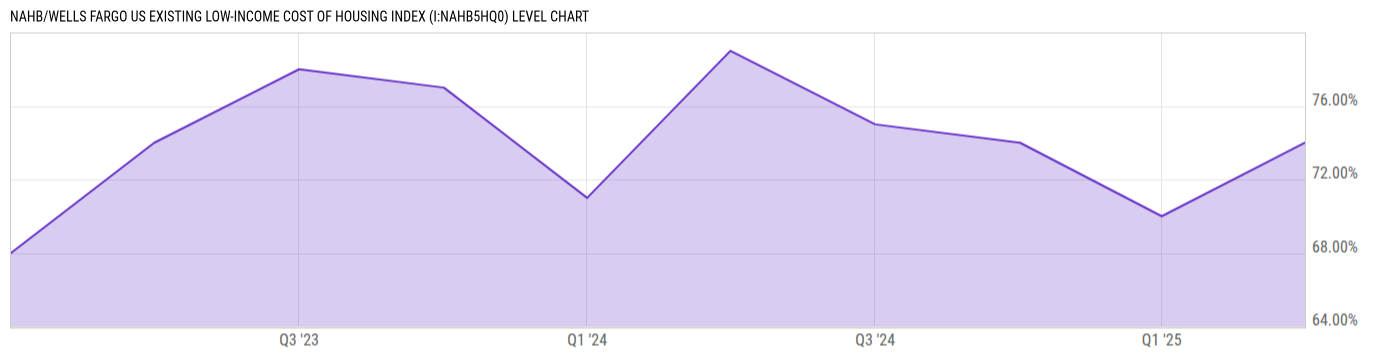
NAHB/Wells Fargo US Existing Low-Income Cost of Housing Index (I:NAHB5HQ0)
74.00% for Q2 2025
Level Chart
Basic Info
|
NAHB/Wells Fargo US Existing Low-Income Cost of Housing Index is at 74.00%, compared to 70.00% last quarter and 79.00% last year. This is lower than the long term average of 74.00%. |
| Report | NAHB/Wells Fargo Cost of Housing Index |
| Category | House Prices |
| Region | United States |
| Source | National Association of Home Builders |
Stats
| Last Value | 74.00% |
| Latest Period | Jun 2025 |
| Last Updated | Aug 21 2025, 12:04 EDT |
| Next Release | Aug 6 2026, 12:00 EDT |
| Long Term Average | 74.00% |
| Average Growth Rate | 4.59% |
| Value from Last Quarter | 70.00% |
| Change from Last Quarter | 5.71% |
| Value from 1 Year Ago | 79.00% |
| Change from 1 Year Ago | -6.33% |
| Frequency | Quarterly |
| Unit | Percent |
| Adjustment | N/A |
| Download Source File |
Historical Data
| Date | Value |
|---|---|
| June 30, 2025 | 74.00% |
| March 31, 2025 | 70.00% |
| December 31, 2024 | 74.00% |
| September 30, 2024 | 75.00% |
| June 30, 2024 | 79.00% |
| Date | Value |
|---|---|
| March 31, 2024 | 71.00% |
| December 31, 2023 | 77.00% |
| September 30, 2023 | 78.00% |
| June 30, 2023 | 74.00% |
| March 31, 2023 | 68.00% |
News
Headline
Time (ET)
05/19 15:28
05/15 07:05
Basic Info
|
NAHB/Wells Fargo US Existing Low-Income Cost of Housing Index is at 74.00%, compared to 70.00% last quarter and 79.00% last year. This is lower than the long term average of 74.00%. |
| Report | NAHB/Wells Fargo Cost of Housing Index |
| Category | House Prices |
| Region | United States |
| Source | National Association of Home Builders |
Stats
| Last Value | 74.00% |
| Latest Period | Jun 2025 |
| Last Updated | Aug 21 2025, 12:04 EDT |
| Next Release | Aug 6 2026, 12:00 EDT |
| Long Term Average | 74.00% |
| Average Growth Rate | 4.59% |
| Value from Last Quarter | 70.00% |
| Change from Last Quarter | 5.71% |
| Value from 1 Year Ago | 79.00% |
| Change from 1 Year Ago | -6.33% |
| Frequency | Quarterly |
| Unit | Percent |
| Adjustment | N/A |
| Download Source File |