

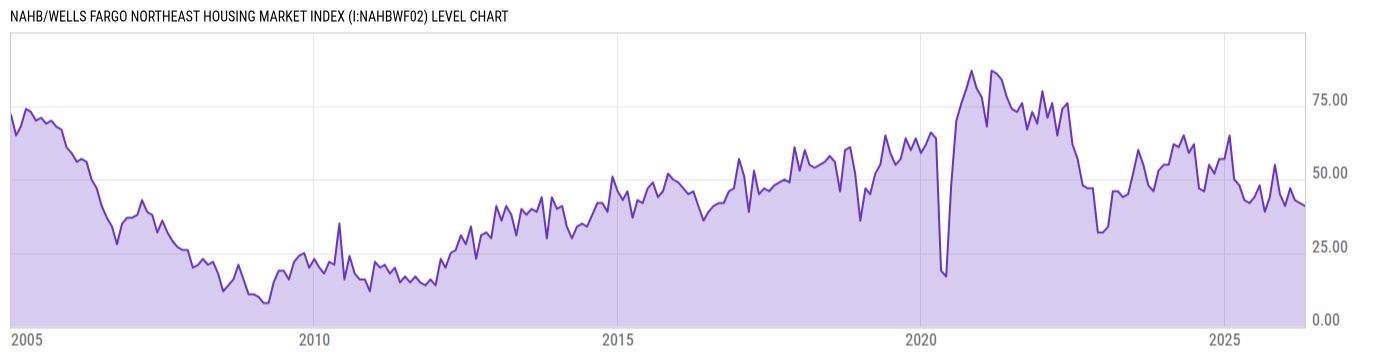
NAHB/Wells Fargo Northeast Housing Market Index (I:NAHBWF02)
44.00 for May 2026
Level Chart
Basic Info
|
NAHB/Wells Fargo Northeast Housing Market Index is at a current level of 44.00, up from 39.00 last month and up from 42.00 one year ago. This is a change of 12.82% from last month and 4.76% from one year ago. |
| Report | NAHB/Wells Fargo Housing Market Index |
| Category | House Prices |
| Region | United States |
| Source | National Association of Home Builders |
Stats
| Last Value | 44.00 |
| Latest Period | May 2026 |
| Last Updated | May 18 2026, 10:02 EDT |
| Next Release | Jun 15 2026, 10:00 EDT |
| Average Growth Rate | 20.73% |
| Value from Last Month | 39.00 |
| Change from Last Month | 12.82% |
| Value from 1 Year Ago | 42.00 |
| Change from 1 Year Ago | 4.76% |
| Frequency | Monthly |
| Adjustment | Seasonally Adjusted |
| Download Source File |
Historical Data
| Date | Value |
|---|---|
| May 31, 2026 | 44.00 |
| April 30, 2026 | 39.00 |
| March 31, 2026 | 42.00 |
| February 28, 2026 | 43.00 |
| January 31, 2026 | 47.00 |
| December 31, 2025 | 41.00 |
| November 30, 2025 | 45.00 |
| October 31, 2025 | 55.00 |
| September 30, 2025 | 44.00 |
| August 31, 2025 | 39.00 |
| July 31, 2025 | 48.00 |
| June 30, 2025 | 44.00 |
| May 31, 2025 | 42.00 |
| April 30, 2025 | 43.00 |
| March 31, 2025 | 48.00 |
| February 28, 2025 | 50.00 |
| January 31, 2025 | 65.00 |
| December 31, 2024 | 57.00 |
| November 30, 2024 | 57.00 |
| October 31, 2024 | 52.00 |
| September 30, 2024 | 55.00 |
| August 31, 2024 | 46.00 |
| July 31, 2024 | 47.00 |
| June 30, 2024 | 62.00 |
| May 31, 2024 | 59.00 |
| Date | Value |
|---|---|
| April 30, 2024 | 65.00 |
| March 31, 2024 | 61.00 |
| February 29, 2024 | 62.00 |
| January 31, 2024 | 55.00 |
| December 31, 2023 | 55.00 |
| November 30, 2023 | 53.00 |
| October 31, 2023 | 46.00 |
| September 30, 2023 | 48.00 |
| August 31, 2023 | 55.00 |
| July 31, 2023 | 60.00 |
| June 30, 2023 | 52.00 |
| May 31, 2023 | 45.00 |
| April 30, 2023 | 44.00 |
| March 31, 2023 | 46.00 |
| February 28, 2023 | 46.00 |
| January 31, 2023 | 34.00 |
| December 31, 2022 | 32.00 |
| November 30, 2022 | 32.00 |
| October 31, 2022 | 47.00 |
| September 30, 2022 | 47.00 |
| August 31, 2022 | 48.00 |
| July 31, 2022 | 57.00 |
| June 30, 2022 | 62.00 |
| May 31, 2022 | 76.00 |
| April 30, 2022 | 74.00 |
News
Headline
Time (ET)
05/15 07:05
Basic Info
|
NAHB/Wells Fargo Northeast Housing Market Index is at a current level of 44.00, up from 39.00 last month and up from 42.00 one year ago. This is a change of 12.82% from last month and 4.76% from one year ago. |
| Report | NAHB/Wells Fargo Housing Market Index |
| Category | House Prices |
| Region | United States |
| Source | National Association of Home Builders |
Stats
| Last Value | 44.00 |
| Latest Period | May 2026 |
| Last Updated | May 18 2026, 10:02 EDT |
| Next Release | Jun 15 2026, 10:00 EDT |
| Average Growth Rate | 20.73% |
| Value from Last Month | 39.00 |
| Change from Last Month | 12.82% |
| Value from 1 Year Ago | 42.00 |
| Change from 1 Year Ago | 4.76% |
| Frequency | Monthly |
| Adjustment | Seasonally Adjusted |
| Download Source File |