

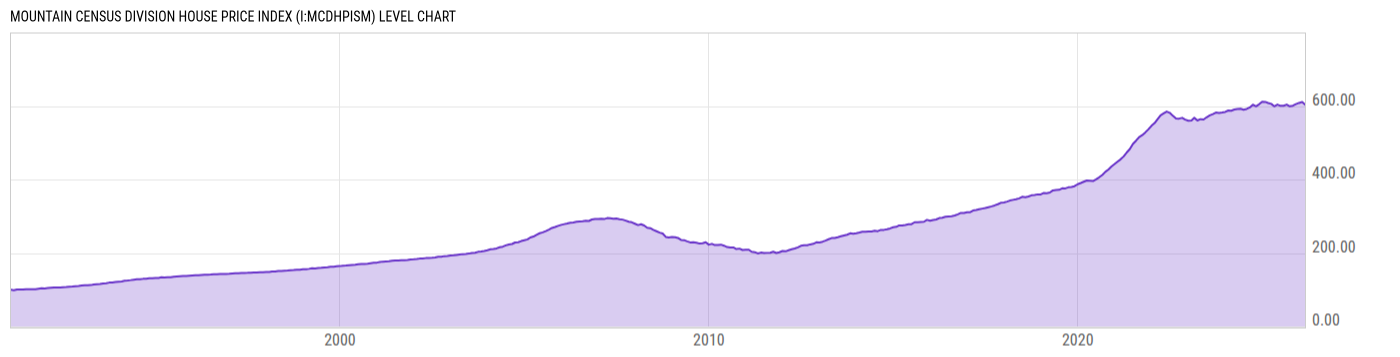
Mountain Census Division House Price Index (I:MCDHPISM)
609.40 for Mar 2026
Level Chart
Basic Info
|
Mountain Census Division House Price Index is at a current level of 609.40, up from 604.09 last month and up from 605.39 one year ago. This is a change of 0.88% from last month and 0.66% from one year ago. |
| Report | FHFA House Price Index |
| Category | House Prices |
| Region | United States |
| Source | Federal Housing Finance Agency |
Stats
| Last Value | 609.40 |
| Latest Period | Mar 2026 |
| Last Updated | May 26 2026, 09:02 EDT |
| Next Release | Jun 30 2026, 09:00 EDT |
| Average Growth Rate | 5.19% |
| Value from Last Month | 604.09 |
| Change from Last Month | 0.88% |
| Value from 1 Year Ago | 605.39 |
| Change from 1 Year Ago | 0.66% |
| Frequency | Monthly |
| Unit | Index January 1991=100 |
| Adjustment | Seasonally Adjusted |
| Download Source File |
Historical Data
| Date | Value |
|---|---|
| March 31, 2026 | 609.40 |
| February 28, 2026 | 604.09 |
| January 31, 2026 | 610.35 |
| December 31, 2025 | 608.25 |
| November 30, 2025 | 605.27 |
| October 31, 2025 | 601.63 |
| September 30, 2025 | 599.09 |
| August 31, 2025 | 603.20 |
| July 31, 2025 | 600.38 |
| June 30, 2025 | 599.63 |
| May 31, 2025 | 602.85 |
| April 30, 2025 | 598.08 |
| March 31, 2025 | 605.39 |
| February 28, 2025 | 607.63 |
| January 31, 2025 | 610.65 |
| December 31, 2024 | 610.90 |
| November 30, 2024 | 603.95 |
| October 31, 2024 | 600.23 |
| September 30, 2024 | 603.21 |
| August 31, 2024 | 595.79 |
| July 31, 2024 | 591.46 |
| June 30, 2024 | 588.90 |
| May 31, 2024 | 591.96 |
| April 30, 2024 | 591.93 |
| March 31, 2024 | 590.10 |
| Date | Value |
|---|---|
| February 29, 2024 | 587.15 |
| January 31, 2024 | 587.76 |
| December 31, 2023 | 583.87 |
| November 30, 2023 | 582.28 |
| October 31, 2023 | 581.12 |
| September 30, 2023 | 582.22 |
| August 31, 2023 | 577.81 |
| July 31, 2023 | 574.39 |
| June 30, 2023 | 569.23 |
| May 31, 2023 | 563.41 |
| April 30, 2023 | 564.13 |
| March 31, 2023 | 560.60 |
| February 28, 2023 | 567.72 |
| January 31, 2023 | 560.78 |
| December 31, 2022 | 559.86 |
| November 30, 2022 | 562.89 |
| October 31, 2022 | 567.69 |
| September 30, 2022 | 565.60 |
| August 31, 2022 | 566.13 |
| July 31, 2022 | 573.20 |
| June 30, 2022 | 581.48 |
| May 31, 2022 | 584.77 |
| April 30, 2022 | 579.70 |
| March 31, 2022 | 574.56 |
| February 28, 2022 | 563.59 |
News
Headline
Time (ET)
06/03 07:13
05/28 12:00
05/15 07:05
05/14 12:00
05/14 07:24
05/07 12:00
Basic Info
|
Mountain Census Division House Price Index is at a current level of 609.40, up from 604.09 last month and up from 605.39 one year ago. This is a change of 0.88% from last month and 0.66% from one year ago. |
| Report | FHFA House Price Index |
| Category | House Prices |
| Region | United States |
| Source | Federal Housing Finance Agency |
Stats
| Last Value | 609.40 |
| Latest Period | Mar 2026 |
| Last Updated | May 26 2026, 09:02 EDT |
| Next Release | Jun 30 2026, 09:00 EDT |
| Average Growth Rate | 5.19% |
| Value from Last Month | 604.09 |
| Change from Last Month | 0.88% |
| Value from 1 Year Ago | 605.39 |
| Change from 1 Year Ago | 0.66% |
| Frequency | Monthly |
| Unit | Index January 1991=100 |
| Adjustment | Seasonally Adjusted |
| Download Source File |