

Morgan Stanley (MS) - Investment Management Income Before Taxes (I:MSMSIMIB)
Level Chart
Basic Info
|
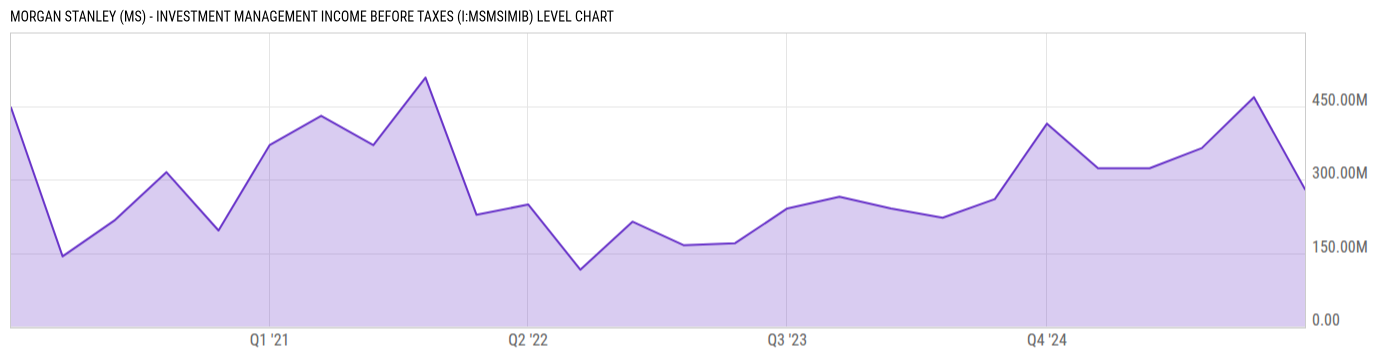
Morgan Stanley (MS) - Investment Management Income Before Taxes is at a current level of 280.00M, down from 468.00M last quarter and down from 323.00M one year ago. This is a change of -40.17% from last quarter and -13.31% from one year ago. |
|
Morgan Stanley Investment Management Income Before Taxes refers to the pre-tax earnings or profit generated by the Investment Management division of Morgan Stanley. |
| Report | Fiscal.ai |
| Category | Segments & KPIs |
| Region | United States |
| Source | Fiscal.ai |
|
Data provided via Fiscal.ai |
Stats
| Last Value | 280.00M |
| Latest Period | Mar 2026 |
| Last Updated | Apr 15 2026, 09:39 EDT |
| Next Release | Jul 15 2026, 08:30 EDT (E) |
| Average Growth Rate | 27.97% |
| Value from Last Quarter | 468.00M |
| Change from Last Quarter | -40.17% |
| Value from 1 Year Ago | 323.00M |
| Change from 1 Year Ago | -13.31% |
| Frequency | Quarterly |
| Unit | USD |
| Adjustment | N/A |
| Download Source File |
Historical Data
| Date | Value |
|---|---|
| March 31, 2026 | 280.00M |
| December 31, 2025 | 468.00M |
| September 30, 2025 | 364.00M |
| June 30, 2025 | 323.00M |
| March 31, 2025 | 323.00M |
| December 31, 2024 | 414.00M |
| September 30, 2024 | 260.00M |
| June 30, 2024 | 222.00M |
| March 31, 2024 | 241.00M |
| December 31, 2023 | 265.00M |
| September 30, 2023 | 241.00M |
| June 30, 2023 | 170.00M |
| March 31, 2023 | 166.00M |
| Date | Value |
|---|---|
| December 31, 2022 | 214.00M |
| September 30, 2022 | 116.00M |
| June 30, 2022 | 249.00M |
| March 31, 2022 | 228.00M |
| December 31, 2021 | 508.00M |
| September 30, 2021 | 370.00M |
| June 30, 2021 | 430.00M |
| March 31, 2021 | 370.00M |
| December 31, 2020 | 196.00M |
| September 30, 2020 | 315.00M |
| June 30, 2020 | 216.00M |
| March 31, 2020 | 143.00M |
| December 31, 2019 | 447.00M |
News
Basic Info
|
Morgan Stanley (MS) - Investment Management Income Before Taxes is at a current level of 280.00M, down from 468.00M last quarter and down from 323.00M one year ago. This is a change of -40.17% from last quarter and -13.31% from one year ago. |
|
Morgan Stanley Investment Management Income Before Taxes refers to the pre-tax earnings or profit generated by the Investment Management division of Morgan Stanley. |
| Report | Fiscal.ai |
| Category | Segments & KPIs |
| Region | United States |
| Source | Fiscal.ai |
|
Data provided via Fiscal.ai |
Stats
| Last Value | 280.00M |
| Latest Period | Mar 2026 |
| Last Updated | Apr 15 2026, 09:39 EDT |
| Next Release | Jul 15 2026, 08:30 EDT (E) |
| Average Growth Rate | 27.97% |
| Value from Last Quarter | 468.00M |
| Change from Last Quarter | -40.17% |
| Value from 1 Year Ago | 323.00M |
| Change from 1 Year Ago | -13.31% |
| Frequency | Quarterly |
| Unit | USD |
| Adjustment | N/A |
| Download Source File |