

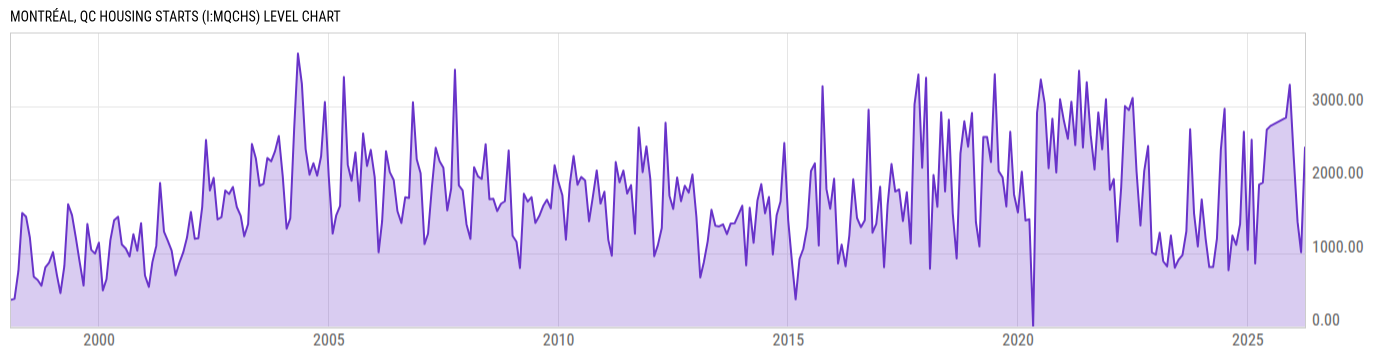
Montréal, QC Housing Starts (I:MQCHS)
2436.00 for Mar 2026
Level Chart
Basic Info
|
Montréal, QC Housing Starts is at a current level of 2436.00, up from 1011.00 last month and up from 1930.00 one year ago. This is a change of 140.9% from last month and 26.22% from one year ago. |
| Report | Canada Housing Information Monthly |
| Category | Construction |
| Region | N/A |
| Source | Canada Mortgage and Housing Corporation |
Stats
| Last Value | 2436.00 |
| Latest Period | Mar 2026 |
| Last Updated | May 15 2026, 09:31 EDT |
| Next Release | Jun 15 2026, 08:30 EDT (E) |
| Average Growth Rate | 103.7% |
| Value from Last Month | 1011.00 |
| Change from Last Month | 140.9% |
| Value from 1 Year Ago | 1930.00 |
| Change from 1 Year Ago | 26.22% |
| Frequency | Monthly |
| Adjustment | Not Seasonally Adjusted |
| Download Source File | |
| Notes | In areas with 10,000+ population. |
Historical Data
| Date | Value |
|---|---|
| March 31, 2026 | 2436.00 |
| February 28, 2026 | 1011.00 |
| January 31, 2026 | 1423.00 |
| December 31, 2025 | 2315.00 |
| November 30, 2025 | 3289.00 |
| October 31, 2025 | 2842.00 |
| June 30, 2025 | 2729.00 |
| May 31, 2025 | 2677.00 |
| April 30, 2025 | 1959.00 |
| March 31, 2025 | 1930.00 |
| February 28, 2025 | 857.00 |
| January 31, 2025 | 2540.00 |
| December 31, 2024 | 1040.00 |
| November 30, 2024 | 2649.00 |
| October 31, 2024 | 1392.00 |
| September 30, 2024 | 1111.00 |
| August 31, 2024 | 1238.00 |
| July 31, 2024 | 767.00 |
| June 30, 2024 | 2962.00 |
| May 31, 2024 | 2402.00 |
| April 30, 2024 | 1194.00 |
| March 31, 2024 | 810.00 |
| February 29, 2024 | 808.00 |
| January 31, 2024 | 1197.00 |
| December 31, 2023 | 1729.00 |
| Date | Value |
|---|---|
| November 30, 2023 | 1089.00 |
| October 31, 2023 | 1540.00 |
| September 30, 2023 | 2682.00 |
| August 31, 2023 | 1296.00 |
| July 31, 2023 | 972.00 |
| June 30, 2023 | 908.00 |
| May 31, 2023 | 800.00 |
| April 30, 2023 | 1237.00 |
| March 31, 2023 | 818.00 |
| February 28, 2023 | 888.00 |
| January 31, 2023 | 1276.00 |
| December 31, 2022 | 976.00 |
| November 30, 2022 | 1009.00 |
| October 31, 2022 | 2457.00 |
| September 30, 2022 | 2114.00 |
| August 31, 2022 | 1374.00 |
| July 31, 2022 | 2109.00 |
| June 30, 2022 | 3110.00 |
| May 31, 2022 | 2944.00 |
| April 30, 2022 | 2999.00 |
| March 31, 2022 | 1897.00 |
| February 28, 2022 | 1155.00 |
| January 31, 2022 | 2005.00 |
| December 31, 2021 | 1860.00 |
| November 30, 2021 | 3091.00 |
News
Headline
Time (ET)
05/15 07:05
05/08 13:15
Basic Info
|
Montréal, QC Housing Starts is at a current level of 2436.00, up from 1011.00 last month and up from 1930.00 one year ago. This is a change of 140.9% from last month and 26.22% from one year ago. |
| Report | Canada Housing Information Monthly |
| Category | Construction |
| Region | N/A |
| Source | Canada Mortgage and Housing Corporation |
Stats
| Last Value | 2436.00 |
| Latest Period | Mar 2026 |
| Last Updated | May 15 2026, 09:31 EDT |
| Next Release | Jun 15 2026, 08:30 EDT (E) |
| Average Growth Rate | 103.7% |
| Value from Last Month | 1011.00 |
| Change from Last Month | 140.9% |
| Value from 1 Year Ago | 1930.00 |
| Change from 1 Year Ago | 26.22% |
| Frequency | Monthly |
| Adjustment | Not Seasonally Adjusted |
| Download Source File | |
| Notes | In areas with 10,000+ population. |