

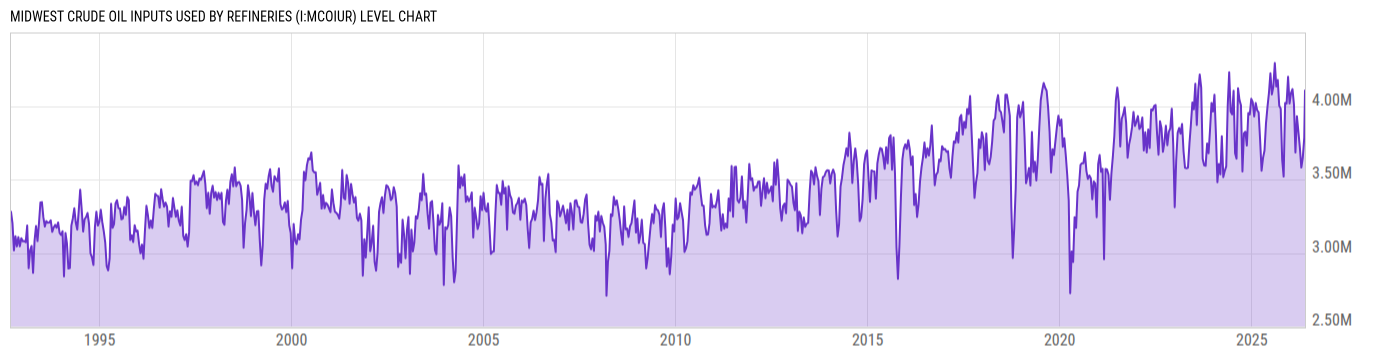
Midwest Crude Oil Inputs Used by Refineries (I:MCOIUR)
4.105M bbl/d for Wk of May 22 2026
Level Chart
Basic Info
|
Midwest Crude Oil Inputs Used by Refineries is at a current level of 4.105M, up from 3.785M last week and up from 3.882M one year ago. This is a change of 8.45% from last week and 5.74% from one year ago. |
| Report | Weekly Petroleum Status |
| Category | Energy |
| Region | N/A |
| Source | Energy Information Administration |
Stats
| Last Value | 4.105M |
| Latest Period | May 22 2026 |
| Last Updated | May 28 2026, 12:03 EDT |
| Average Growth Rate | 3.31% |
| Value from Last Week | 3.785M |
| Change from Last Week | 8.45% |
| Value from 1 Year Ago | 3.882M |
| Change from 1 Year Ago | 5.74% |
| Frequency | Weekly |
| Unit | Barrels per Day |
| Adjustment | N/A |
| Download Source File | |
| Notes | Net input of crude oil. Petroleum Administration for Defense District: PADD 2 |
Historical Data
| Date | Value |
|---|---|
| May 22, 2026 | 4.105M |
| May 15, 2026 | 3.785M |
| May 08, 2026 | 3.788M |
| May 01, 2026 | 3.649M |
| April 24, 2026 | 3.616M |
| April 17, 2026 | 3.581M |
| April 10, 2026 | 3.605M |
| April 03, 2026 | 3.719M |
| March 27, 2026 | 3.672M |
| March 20, 2026 | 3.826M |
| March 13, 2026 | 3.845M |
| March 06, 2026 | 3.931M |
| February 27, 2026 | 3.883M |
| February 20, 2026 | 3.684M |
| February 13, 2026 | 3.999M |
| February 06, 2026 | 4.01M |
| January 30, 2026 | 3.868M |
| January 23, 2026 | 4.115M |
| January 16, 2026 | 4.071M |
| January 09, 2026 | 4.088M |
| January 02, 2026 | 4.079M |
| December 26, 2025 | 4.017M |
| December 19, 2025 | 4.117M |
| December 12, 2025 | 4.199M |
| December 05, 2025 | 4.113M |
| Date | Value |
|---|---|
| November 28, 2025 | 4.016M |
| November 21, 2025 | 3.999M |
| November 14, 2025 | 4.021M |
| November 07, 2025 | 3.755M |
| October 31, 2025 | 3.52M |
| October 24, 2025 | 3.418M |
| October 17, 2025 | 3.635M |
| October 10, 2025 | 3.589M |
| October 03, 2025 | 3.982M |
| September 26, 2025 | 4.029M |
| September 19, 2025 | 4.002M |
| September 12, 2025 | 3.957M |
| September 05, 2025 | 4.177M |
| August 29, 2025 | 3.985M |
| August 22, 2025 | 4.133M |
| August 15, 2025 | 4.276M |
| August 08, 2025 | 4.292M |
| August 01, 2025 | 4.209M |
| July 25, 2025 | 4.133M |
| July 18, 2025 | 4.161M |
| July 11, 2025 | 4.079M |
| July 04, 2025 | 4.168M |
| June 27, 2025 | 4.223M |
| June 20, 2025 | 4.216M |
| June 13, 2025 | 4.087M |
News
Headline
Time (ET)
05/27 06:13
05/21 14:40
05/20 16:03
05/13 14:39
Basic Info
|
Midwest Crude Oil Inputs Used by Refineries is at a current level of 4.105M, up from 3.785M last week and up from 3.882M one year ago. This is a change of 8.45% from last week and 5.74% from one year ago. |
| Report | Weekly Petroleum Status |
| Category | Energy |
| Region | N/A |
| Source | Energy Information Administration |
Stats
| Last Value | 4.105M |
| Latest Period | May 22 2026 |
| Last Updated | May 28 2026, 12:03 EDT |
| Average Growth Rate | 3.31% |
| Value from Last Week | 3.785M |
| Change from Last Week | 8.45% |
| Value from 1 Year Ago | 3.882M |
| Change from 1 Year Ago | 5.74% |
| Frequency | Weekly |
| Unit | Barrels per Day |
| Adjustment | N/A |
| Download Source File | |
| Notes | Net input of crude oil. Petroleum Administration for Defense District: PADD 2 |