

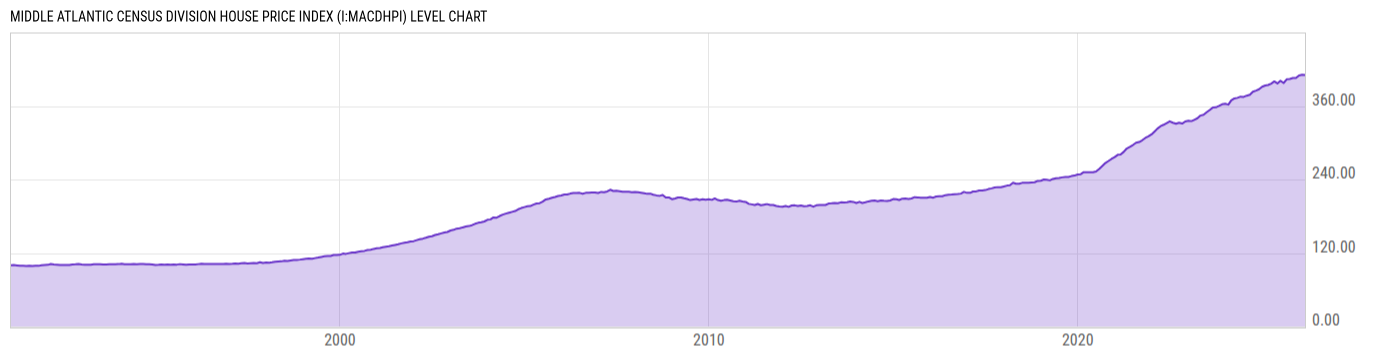
Middle Atlantic Census Division House Price Index (I:MACDHPI)
411.32 for Mar 2026
Level Chart
Basic Info
|
Middle Atlantic Census Division House Price Index is at a current level of 411.32, up from 410.23 last month and up from 396.55 one year ago. This is a change of 0.27% from last month and 3.72% from one year ago. |
| Report | FHFA House Price Index |
| Category | House Prices |
| Region | United States |
| Source | Federal Housing Finance Agency |
Stats
| Last Value | 411.32 |
| Latest Period | Mar 2026 |
| Last Updated | May 26 2026, 09:02 EDT |
| Next Release | Jun 30 2026, 09:00 EDT |
| Average Growth Rate | 4.05% |
| Value from Last Month | 410.23 |
| Change from Last Month | 0.27% |
| Value from 1 Year Ago | 396.55 |
| Change from 1 Year Ago | 3.72% |
| Frequency | Monthly |
| Unit | Index January 1991=100 |
| Adjustment | Seasonally Adjusted |
| Download Source File |
Historical Data
| Date | Value |
|---|---|
| March 31, 2026 | 411.32 |
| February 28, 2026 | 410.23 |
| January 31, 2026 | 410.76 |
| December 31, 2025 | 409.85 |
| November 30, 2025 | 405.59 |
| October 31, 2025 | 405.48 |
| September 30, 2025 | 403.84 |
| August 31, 2025 | 403.58 |
| July 31, 2025 | 397.43 |
| June 30, 2025 | 401.13 |
| May 31, 2025 | 396.76 |
| April 30, 2025 | 399.96 |
| March 31, 2025 | 396.55 |
| February 28, 2025 | 393.86 |
| January 31, 2025 | 392.93 |
| December 31, 2024 | 391.07 |
| November 30, 2024 | 387.21 |
| October 31, 2024 | 384.98 |
| September 30, 2024 | 382.99 |
| August 31, 2024 | 378.30 |
| July 31, 2024 | 376.70 |
| June 30, 2024 | 374.75 |
| May 31, 2024 | 374.96 |
| April 30, 2024 | 372.88 |
| March 31, 2024 | 371.99 |
| Date | Value |
|---|---|
| February 29, 2024 | 369.09 |
| January 31, 2024 | 362.22 |
| December 31, 2023 | 363.65 |
| November 30, 2023 | 362.70 |
| October 31, 2023 | 360.23 |
| September 30, 2023 | 357.89 |
| August 31, 2023 | 357.72 |
| July 31, 2023 | 353.50 |
| June 30, 2023 | 349.76 |
| May 31, 2023 | 345.79 |
| April 30, 2023 | 344.32 |
| March 31, 2023 | 340.01 |
| February 28, 2023 | 337.49 |
| January 31, 2023 | 335.31 |
| December 31, 2022 | 335.81 |
| November 30, 2022 | 334.63 |
| October 31, 2022 | 331.30 |
| September 30, 2022 | 332.67 |
| August 31, 2022 | 331.04 |
| July 31, 2022 | 332.66 |
| June 30, 2022 | 334.92 |
| May 31, 2022 | 332.21 |
| April 30, 2022 | 329.35 |
| March 31, 2022 | 327.04 |
| February 28, 2022 | 323.05 |
News
Headline
Time (ET)
06/03 07:13
05/28 12:00
05/15 07:05
05/14 12:00
05/14 07:24
05/07 12:00
Basic Info
|
Middle Atlantic Census Division House Price Index is at a current level of 411.32, up from 410.23 last month and up from 396.55 one year ago. This is a change of 0.27% from last month and 3.72% from one year ago. |
| Report | FHFA House Price Index |
| Category | House Prices |
| Region | United States |
| Source | Federal Housing Finance Agency |
Stats
| Last Value | 411.32 |
| Latest Period | Mar 2026 |
| Last Updated | May 26 2026, 09:02 EDT |
| Next Release | Jun 30 2026, 09:00 EDT |
| Average Growth Rate | 4.05% |
| Value from Last Month | 410.23 |
| Change from Last Month | 0.27% |
| Value from 1 Year Ago | 396.55 |
| Change from 1 Year Ago | 3.72% |
| Frequency | Monthly |
| Unit | Index January 1991=100 |
| Adjustment | Seasonally Adjusted |
| Download Source File |