

Microsoft Corp (MSFT) - Productivity & Business Processes Operating Income (Pre-FY2025) (I:MCMSH7PW)
Level Chart
Basic Info
|
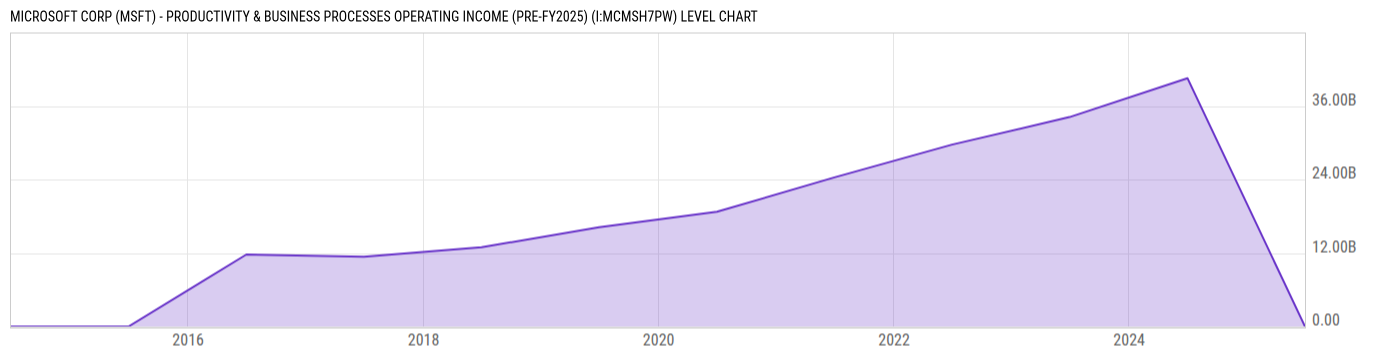
Microsoft Corp (MSFT) - Productivity & Business Processes Operating Income (Pre-FY2025) is at a current level of 0.000, down from 40.54B one year ago. This is a change of -100.0% from one year ago. |
| Report | Fiscal.ai |
| Category | Segments & KPIs |
| Region | United States |
| Source | Fiscal.ai |
|
Data provided via Fiscal.ai |
Stats
| Last Value | 0.00 |
| Latest Period | 2025 |
| Last Updated | Mar 23 2026, 14:11 EDT |
| Next Release | Feb 1 2027, 08:30 EST (E) |
| Average Growth Rate | 4.11% |
| Value from 1 Year Ago | 40.54B |
| Change from 1 Year Ago | -100.0% |
| Frequency | Yearly |
| Unit | USD |
| Adjustment | N/A |
| Download Source File |
Historical Data
| Date | Value |
|---|---|
| June 30, 2025 | 0.00 |
| June 30, 2024 | 40.54B |
| June 30, 2023 | 34.19B |
| June 30, 2022 | 29.69B |
| June 30, 2021 | 24.35B |
| June 30, 2020 | 18.72B |
| Date | Value |
|---|---|
| June 30, 2019 | 16.22B |
| June 30, 2018 | 12.92B |
| June 30, 2017 | 11.39B |
| June 30, 2016 | 11.76B |
| June 30, 2015 | 0.00 |
| June 30, 2014 | 0.00 |
News
Headline
Time (ET)
05/22 14:40
05/11 16:10
05/08 08:40
Basic Info
|
Microsoft Corp (MSFT) - Productivity & Business Processes Operating Income (Pre-FY2025) is at a current level of 0.000, down from 40.54B one year ago. This is a change of -100.0% from one year ago. |
| Report | Fiscal.ai |
| Category | Segments & KPIs |
| Region | United States |
| Source | Fiscal.ai |
|
Data provided via Fiscal.ai |
Stats
| Last Value | 0.00 |
| Latest Period | 2025 |
| Last Updated | Mar 23 2026, 14:11 EDT |
| Next Release | Feb 1 2027, 08:30 EST (E) |
| Average Growth Rate | 4.11% |
| Value from 1 Year Ago | 40.54B |
| Change from 1 Year Ago | -100.0% |
| Frequency | Yearly |
| Unit | USD |
| Adjustment | N/A |
| Download Source File |