

Merck & Co. Inc. (MRK) - Pharmaceutical Revenue (I:MCIMVWPP)
Level Chart
Basic Info
|
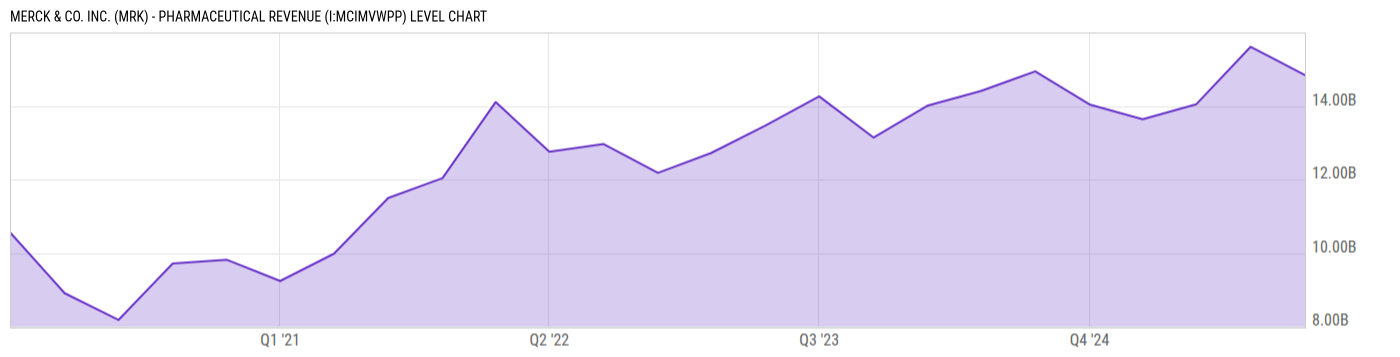
Merck & Co. Inc. (MRK) - Pharmaceutical Revenue is at a current level of 14.84B, down from 15.61B last quarter and up from 14.04B one year ago. This is a change of -4.92% from last quarter and 5.70% from one year ago. |
|
Pharmaceutical Revenue refers to the total revenue generated by Merck from the sale of its pharmaceutical products. This includes revenue from prescription drugs, over-the-counter medications, vaccines, and other pharmaceutical products developed and marketed by the company. |
| Report | Fiscal.ai |
| Category | Segments & KPIs |
| Region | United States |
| Source | Fiscal.ai |
|
Data provided via Fiscal.ai |
Stats
| Last Value | 14.84B |
| Latest Period | Dec 2025 |
| Last Updated | Mar 23 2026, 14:11 EDT |
| Next Release | Jul 15 2026, 23:00 EDT (E) |
| Average Growth Rate | 7.21% |
| Value from Last Quarter | 15.61B |
| Change from Last Quarter | -4.92% |
| Value from 1 Year Ago | 14.04B |
| Change from 1 Year Ago | 5.70% |
| Frequency | Quarterly |
| Unit | USD |
| Adjustment | N/A |
| Download Source File |
Historical Data
| Date | Value |
|---|---|
| December 31, 2025 | 14.84B |
| September 30, 2025 | 15.61B |
| June 30, 2025 | 14.05B |
| March 31, 2025 | 13.64B |
| December 31, 2024 | 14.04B |
| September 30, 2024 | 14.94B |
| June 30, 2024 | 14.41B |
| March 31, 2024 | 14.01B |
| December 31, 2023 | 13.14B |
| September 30, 2023 | 14.26B |
| June 30, 2023 | 13.46B |
| March 31, 2023 | 12.72B |
| December 31, 2022 | 12.18B |
| Date | Value |
|---|---|
| September 30, 2022 | 12.96B |
| June 30, 2022 | 12.76B |
| March 31, 2022 | 14.11B |
| December 31, 2021 | 12.04B |
| September 30, 2021 | 11.50B |
| June 30, 2021 | 9.98B |
| March 31, 2021 | 9.238B |
| December 31, 2020 | 9.813B |
| September 30, 2020 | 9.714B |
| June 30, 2020 | 8.178B |
| March 31, 2020 | 8.905B |
| December 31, 2019 | 10.53B |
News
Basic Info
|
Merck & Co. Inc. (MRK) - Pharmaceutical Revenue is at a current level of 14.84B, down from 15.61B last quarter and up from 14.04B one year ago. This is a change of -4.92% from last quarter and 5.70% from one year ago. |
|
Pharmaceutical Revenue refers to the total revenue generated by Merck from the sale of its pharmaceutical products. This includes revenue from prescription drugs, over-the-counter medications, vaccines, and other pharmaceutical products developed and marketed by the company. |
| Report | Fiscal.ai |
| Category | Segments & KPIs |
| Region | United States |
| Source | Fiscal.ai |
|
Data provided via Fiscal.ai |
Stats
| Last Value | 14.84B |
| Latest Period | Dec 2025 |
| Last Updated | Mar 23 2026, 14:11 EDT |
| Next Release | Jul 15 2026, 23:00 EDT (E) |
| Average Growth Rate | 7.21% |
| Value from Last Quarter | 15.61B |
| Change from Last Quarter | -4.92% |
| Value from 1 Year Ago | 14.04B |
| Change from 1 Year Ago | 5.70% |
| Frequency | Quarterly |
| Unit | USD |
| Adjustment | N/A |
| Download Source File |
Related Securities
Related Indicators
| Merck & Co. Inc. (MRK) - Animal Health Revenue | 6.354B USD |
| Merck & Co. Inc. (MRK) - Animal Health Revenue | 1.505B USD |