

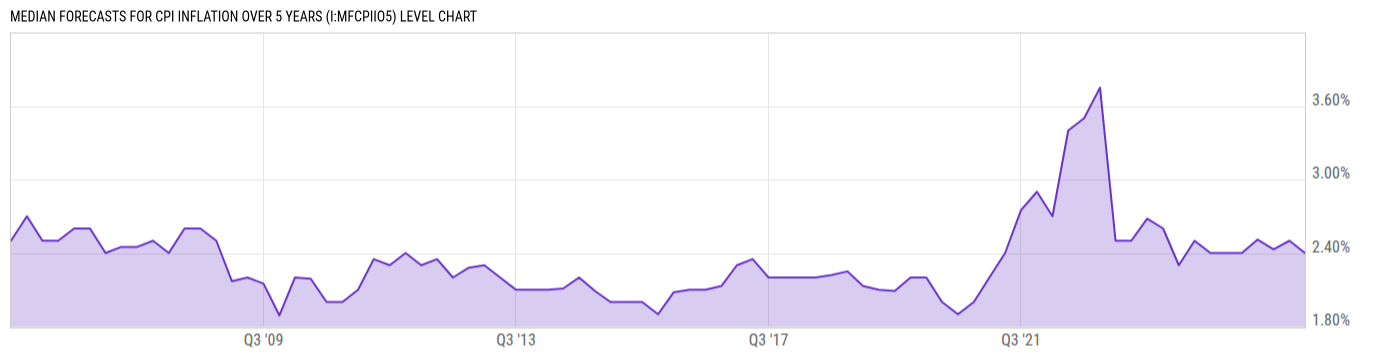
Median Forecasts for CPI Inflation Over 5 Years (I:MFCPIIO5)
2.40% for Q1 2026
Level Chart
Basic Info
|
Median Forecasts for CPI Inflation Over 5 Years is at 2.40%, compared to 2.50% last quarter and 2.40% last year. This is higher than the long term average of 2.34%. |
| Region | United States |
| Source | Federal Reserve Bank of Philadelphia |
Stats
| Last Value | 2.40% |
| Latest Period | Mar 2026 |
| Last Updated | Mar 13 2026, 14:24 EDT |
| Long Term Average | 2.34% |
| Average Growth Rate | 0.93% |
| Value from Last Quarter | 2.50% |
| Change from Last Quarter | -4.00% |
| Value from 1 Year Ago | 2.40% |
| Change from 1 Year Ago | 0.00% |
| Frequency | Quarterly |
| Unit | Percent |
| Adjustment | Seasonally Adjusted Annual Rate |
| Download Source File | |
| Notes | Forecasts for the annual-average rate of headline CPI inflation over the next five years. The “next five years” includes the year in which we conducted the survey and the following four years. Conceptually, the calculation of inflation is one that runs from the fourth quarter of the year before the survey year to the fourth quarter of the year that is five years beyond the survey year, representing a total of 20 quarters or five years. The fourth-quarter level is the quarterly average of the underlying monthly levels. Data always shows the latest forecast. |
Historical Data
| Date | Value |
|---|---|
| March 31, 2026 | 2.40% |
| December 31, 2025 | 2.50% |
| September 30, 2025 | 2.43% |
| June 30, 2025 | 2.51% |
| March 31, 2025 | 2.40% |
| December 31, 2024 | 2.40% |
| September 30, 2024 | 2.40% |
| June 30, 2024 | 2.50% |
| March 31, 2024 | 2.30% |
| December 31, 2023 | 2.60% |
| September 30, 2023 | 2.68% |
| June 30, 2023 | 2.50% |
| March 31, 2023 | 2.50% |
| December 31, 2022 | 3.75% |
| September 30, 2022 | 3.50% |
| June 30, 2022 | 3.40% |
| March 31, 2022 | 2.70% |
| December 31, 2021 | 2.90% |
| September 30, 2021 | 2.75% |
| June 30, 2021 | 2.40% |
| March 31, 2021 | 2.20% |
| December 31, 2020 | 2.00% |
| September 30, 2020 | 1.90% |
| June 30, 2020 | 2.00% |
| March 31, 2020 | 2.20% |
| Date | Value |
|---|---|
| December 31, 2019 | 2.20% |
| September 30, 2019 | 2.09% |
| June 30, 2019 | 2.10% |
| March 31, 2019 | 2.13% |
| December 31, 2018 | 2.25% |
| September 30, 2018 | 2.22% |
| June 30, 2018 | 2.20% |
| March 31, 2018 | 2.20% |
| December 31, 2017 | 2.20% |
| September 30, 2017 | 2.20% |
| June 30, 2017 | 2.35% |
| March 31, 2017 | 2.30% |
| December 31, 2016 | 2.13% |
| September 30, 2016 | 2.10% |
| June 30, 2016 | 2.10% |
| March 31, 2016 | 2.08% |
| December 31, 2015 | 1.90% |
| September 30, 2015 | 2.00% |
| June 30, 2015 | 2.00% |
| March 31, 2015 | 2.00% |
| December 31, 2014 | 2.09% |
| September 30, 2014 | 2.20% |
| June 30, 2014 | 2.11% |
| March 31, 2014 | 2.10% |
| December 31, 2013 | 2.10% |
News
Headline
Time (ET)
05/25 09:56
05/11 07:48
05/08 07:44
05/01 07:23
Basic Info
|
Median Forecasts for CPI Inflation Over 5 Years is at 2.40%, compared to 2.50% last quarter and 2.40% last year. This is higher than the long term average of 2.34%. |
| Region | United States |
| Source | Federal Reserve Bank of Philadelphia |
Stats
| Last Value | 2.40% |
| Latest Period | Mar 2026 |
| Last Updated | Mar 13 2026, 14:24 EDT |
| Long Term Average | 2.34% |
| Average Growth Rate | 0.93% |
| Value from Last Quarter | 2.50% |
| Change from Last Quarter | -4.00% |
| Value from 1 Year Ago | 2.40% |
| Change from 1 Year Ago | 0.00% |
| Frequency | Quarterly |
| Unit | Percent |
| Adjustment | Seasonally Adjusted Annual Rate |
| Download Source File | |
| Notes | Forecasts for the annual-average rate of headline CPI inflation over the next five years. The “next five years” includes the year in which we conducted the survey and the following four years. Conceptually, the calculation of inflation is one that runs from the fourth quarter of the year before the survey year to the fourth quarter of the year that is five years beyond the survey year, representing a total of 20 quarters or five years. The fourth-quarter level is the quarterly average of the underlying monthly levels. Data always shows the latest forecast. |