

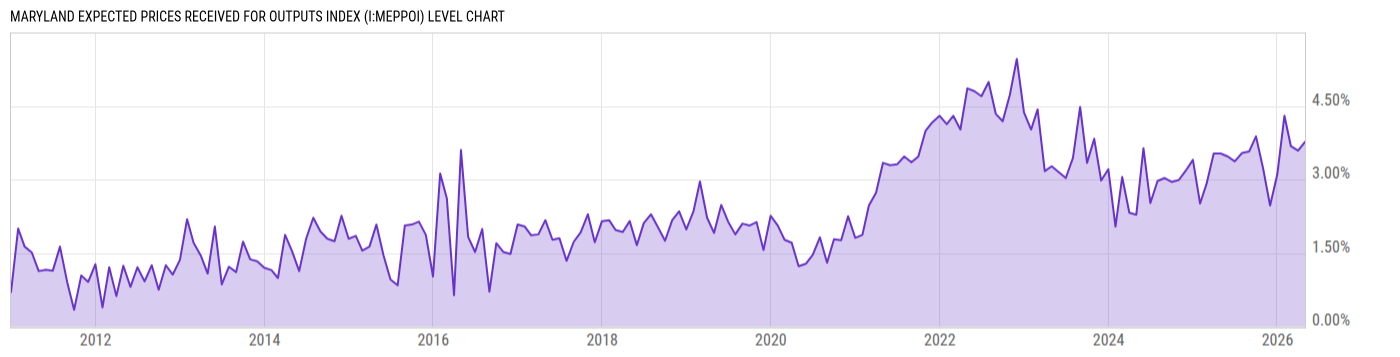
Maryland Expected Prices Received for Outputs Index (I:MEPPOI)
3.26% for May 2026
Level Chart
Basic Info
|
Maryland Expected Prices Received for Outputs Index is at 3.26%, compared to 3.77% last month and 3.47% last year. This is higher than the long term average of 2.31%. |
| Report | Maryland Survey of Business Activity |
| Category | Nonfinancial Business Statistics |
| Region | Maryland |
| Source | Federal Reserve Bank of Richmond |
Stats
| Last Value | 3.26% |
| Latest Period | May 2026 |
| Last Updated | May 28 2026, 10:07 EDT |
| Next Release | Jun 25 2026, 10:00 EDT |
| Long Term Average | 2.31% |
| Average Growth Rate | 107.3% |
| Value from Last Month | 3.77% |
| Change from Last Month | -13.53% |
| Value from 1 Year Ago | 3.47% |
| Change from 1 Year Ago | -6.05% |
| Frequency | Monthly |
| Unit | Percent |
| Adjustment | N/A |
| Download Source File |
Historical Data
| Date | Value |
|---|---|
| May 31, 2026 | 3.26% |
| April 30, 2026 | 3.77% |
| March 31, 2026 | 3.59% |
| February 28, 2026 | 3.68% |
| January 31, 2026 | 4.30% |
| December 31, 2025 | 3.10% |
| November 30, 2025 | 2.47% |
| October 31, 2025 | 3.22% |
| September 30, 2025 | 3.88% |
| August 31, 2025 | 3.57% |
| July 31, 2025 | 3.54% |
| June 30, 2025 | 3.37% |
| May 31, 2025 | 3.47% |
| April 30, 2025 | 3.53% |
| March 31, 2025 | 3.53% |
| February 28, 2025 | 2.91% |
| January 31, 2025 | 2.51% |
| December 31, 2024 | 3.40% |
| November 30, 2024 | 3.18% |
| October 31, 2024 | 2.99% |
| September 30, 2024 | 2.95% |
| August 31, 2024 | 3.03% |
| July 31, 2024 | 2.97% |
| June 30, 2024 | 2.52% |
| May 31, 2024 | 3.64% |
| Date | Value |
|---|---|
| April 30, 2024 | 2.28% |
| March 31, 2024 | 2.32% |
| February 29, 2024 | 3.05% |
| January 31, 2024 | 2.04% |
| December 31, 2023 | 3.21% |
| November 30, 2023 | 2.98% |
| October 31, 2023 | 3.83% |
| September 30, 2023 | 3.34% |
| August 31, 2023 | 4.48% |
| July 31, 2023 | 3.44% |
| June 30, 2023 | 3.03% |
| May 31, 2023 | 3.15% |
| April 30, 2023 | 3.27% |
| March 31, 2023 | 3.17% |
| February 28, 2023 | 4.43% |
| January 31, 2023 | 4.02% |
| December 31, 2022 | 4.37% |
| November 30, 2022 | 5.46% |
| October 31, 2022 | 4.73% |
| September 30, 2022 | 4.19% |
| August 31, 2022 | 4.34% |
| July 31, 2022 | 4.99% |
| June 30, 2022 | 4.70% |
| May 31, 2022 | 4.80% |
| April 30, 2022 | 4.86% |
News
Headline
Time (ET)
05/26 07:34
05/11 07:48
05/08 13:15
Basic Info
|
Maryland Expected Prices Received for Outputs Index is at 3.26%, compared to 3.77% last month and 3.47% last year. This is higher than the long term average of 2.31%. |
| Report | Maryland Survey of Business Activity |
| Category | Nonfinancial Business Statistics |
| Region | Maryland |
| Source | Federal Reserve Bank of Richmond |
Stats
| Last Value | 3.26% |
| Latest Period | May 2026 |
| Last Updated | May 28 2026, 10:07 EDT |
| Next Release | Jun 25 2026, 10:00 EDT |
| Long Term Average | 2.31% |
| Average Growth Rate | 107.3% |
| Value from Last Month | 3.77% |
| Change from Last Month | -13.53% |
| Value from 1 Year Ago | 3.47% |
| Change from 1 Year Ago | -6.05% |
| Frequency | Monthly |
| Unit | Percent |
| Adjustment | N/A |
| Download Source File |