

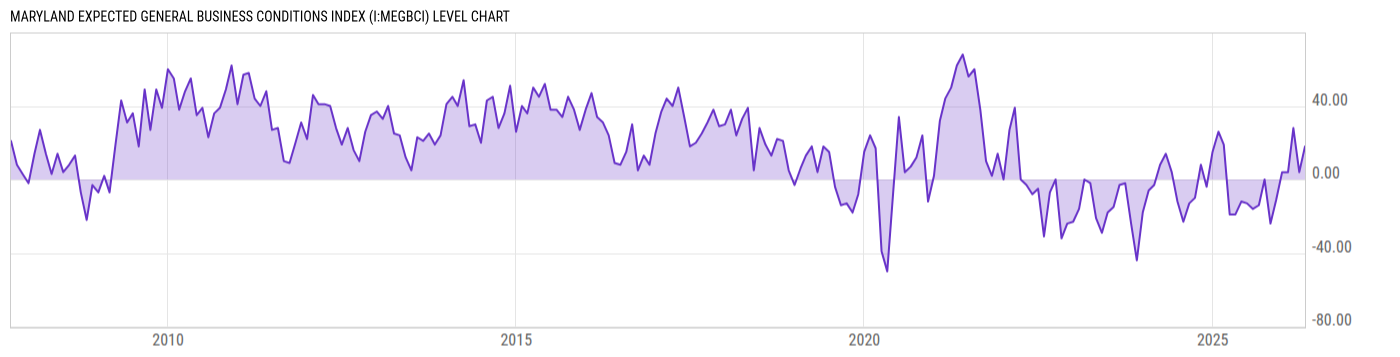
Maryland Expected General Business Conditions Index (I:MEGBCI)
19.00 for May 2026
Level Chart
Basic Info
|
Maryland Expected General Business Conditions Index is at a current level of 19.00, up from 18.00 last month and up from -12.00 one year ago. This is a change of 5.56% from last month. |
| Report | Maryland Survey of Business Activity |
| Category | Nonfinancial Business Statistics |
| Region | Maryland |
| Source | Federal Reserve Bank of Richmond |
Stats
| Last Value | 19.00 |
| Latest Period | May 2026 |
| Last Updated | May 28 2026, 10:07 EDT |
| Next Release | Jun 25 2026, 10:00 EDT |
| Average Growth Rate | 98.94% |
| Value from Last Month | 18.00 |
| Change from Last Month | 5.56% |
| Value from 1 Year Ago | -12.00 |
| Change from 1 Year Ago | N/A |
| Frequency | Monthly |
| Adjustment | N/A |
| Download Source File |
Historical Data
| Date | Value |
|---|---|
| May 31, 2026 | 19.00 |
| April 30, 2026 | 18.00 |
| March 31, 2026 | 4.00 |
| February 28, 2026 | 28.00 |
| January 31, 2026 | 4.00 |
| December 31, 2025 | 4.00 |
| November 30, 2025 | -11.00 |
| October 31, 2025 | -24.00 |
| September 30, 2025 | 0.00 |
| August 31, 2025 | -14.00 |
| July 31, 2025 | -16.00 |
| June 30, 2025 | -13.00 |
| May 31, 2025 | -12.00 |
| April 30, 2025 | -19.00 |
| March 31, 2025 | -19.00 |
| February 28, 2025 | 19.00 |
| January 31, 2025 | 26.00 |
| December 31, 2024 | 15.00 |
| November 30, 2024 | -4.00 |
| October 31, 2024 | 8.00 |
| September 30, 2024 | -10.00 |
| August 31, 2024 | -13.00 |
| July 31, 2024 | -23.00 |
| June 30, 2024 | -12.00 |
| May 31, 2024 | 4.00 |
| Date | Value |
|---|---|
| April 30, 2024 | 14.00 |
| March 31, 2024 | 8.00 |
| February 29, 2024 | -3.00 |
| January 31, 2024 | -6.00 |
| December 31, 2023 | -18.00 |
| November 30, 2023 | -44.00 |
| October 31, 2023 | -24.00 |
| September 30, 2023 | -2.00 |
| August 31, 2023 | -3.00 |
| July 31, 2023 | -15.00 |
| June 30, 2023 | -18.00 |
| May 31, 2023 | -29.00 |
| April 30, 2023 | -21.00 |
| March 31, 2023 | -2.00 |
| February 28, 2023 | 0.00 |
| January 31, 2023 | -16.00 |
| December 31, 2022 | -23.00 |
| November 30, 2022 | -24.00 |
| October 31, 2022 | -32.00 |
| September 30, 2022 | 0.00 |
| August 31, 2022 | -7.00 |
| July 31, 2022 | -31.00 |
| June 30, 2022 | -5.00 |
| May 31, 2022 | -8.00 |
| April 30, 2022 | -3.00 |
News
Headline
Time (ET)
05/26 07:34
05/11 07:48
05/08 13:15
Basic Info
|
Maryland Expected General Business Conditions Index is at a current level of 19.00, up from 18.00 last month and up from -12.00 one year ago. This is a change of 5.56% from last month. |
| Report | Maryland Survey of Business Activity |
| Category | Nonfinancial Business Statistics |
| Region | Maryland |
| Source | Federal Reserve Bank of Richmond |
Stats
| Last Value | 19.00 |
| Latest Period | May 2026 |
| Last Updated | May 28 2026, 10:07 EDT |
| Next Release | Jun 25 2026, 10:00 EDT |
| Average Growth Rate | 98.94% |
| Value from Last Month | 18.00 |
| Change from Last Month | 5.56% |
| Value from 1 Year Ago | -12.00 |
| Change from 1 Year Ago | N/A |
| Frequency | Monthly |
| Adjustment | N/A |
| Download Source File |