

Manitoba New Housing Price Index (I:MNHPI)
147.80 for Apr 2026
Level Chart
Basic Info
|
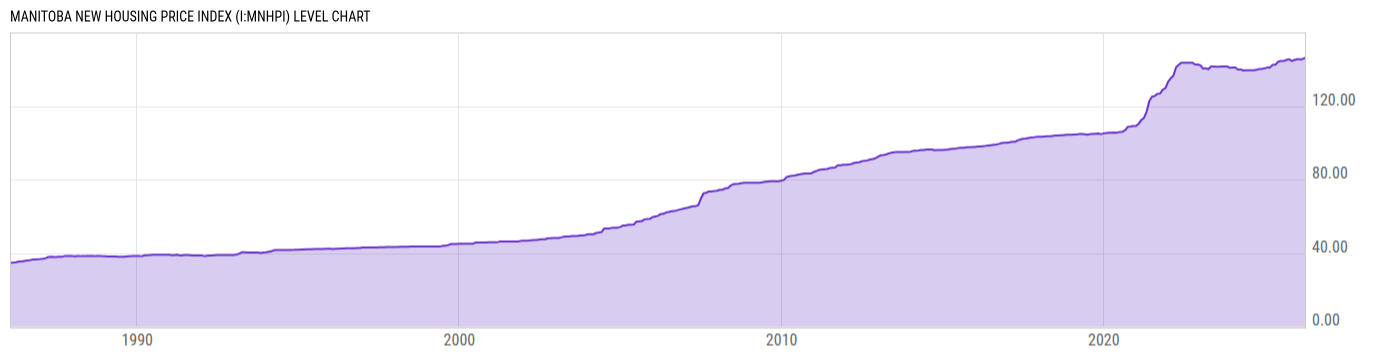
Manitoba New Housing Price Index is at a current level of 147.80, up from 146.10 last month and up from 142.50 one year ago. This is a change of 1.16% from last month and 3.72% from one year ago. |
| Report | Canada New Housing Price Index |
| Category | House Prices |
| Region | Manitoba |
| Source | Statistics Canada |
Stats
| Last Value | 147.80 |
| Latest Period | Apr 2026 |
| Last Updated | May 19 2026, 09:34 EDT |
| Next Release | Jun 17 2026, 09:30 EDT |
| Average Growth Rate | 3.63% |
| Value from Last Month | 146.10 |
| Change from Last Month | 1.16% |
| Value from 1 Year Ago | 142.50 |
| Change from 1 Year Ago | 3.72% |
| Frequency | Monthly |
| Unit | Index December 2016=100 |
| Adjustment | Not Seasonally Adjusted |
| Download Source File |
Historical Data
| Date | Value |
|---|---|
| April 30, 2026 | 147.80 |
| March 31, 2026 | 146.10 |
| February 28, 2026 | 145.50 |
| January 31, 2026 | 145.40 |
| December 31, 2025 | 145.40 |
| November 30, 2025 | 145.00 |
| October 31, 2025 | 144.50 |
| September 30, 2025 | 145.50 |
| August 31, 2025 | 145.00 |
| July 31, 2025 | 144.50 |
| June 30, 2025 | 144.50 |
| May 31, 2025 | 144.10 |
| April 30, 2025 | 142.50 |
| March 31, 2025 | 142.50 |
| February 28, 2025 | 141.00 |
| January 31, 2025 | 141.00 |
| December 31, 2024 | 140.50 |
| November 30, 2024 | 140.20 |
| October 31, 2024 | 140.20 |
| September 30, 2024 | 139.70 |
| August 31, 2024 | 139.40 |
| July 31, 2024 | 139.40 |
| June 30, 2024 | 139.50 |
| May 31, 2024 | 139.40 |
| April 30, 2024 | 139.30 |
| Date | Value |
|---|---|
| March 31, 2024 | 139.90 |
| February 29, 2024 | 139.80 |
| January 31, 2024 | 141.00 |
| December 31, 2023 | 140.90 |
| November 30, 2023 | 140.80 |
| October 31, 2023 | 141.50 |
| September 30, 2023 | 141.50 |
| August 31, 2023 | 141.50 |
| July 31, 2023 | 141.40 |
| June 30, 2023 | 141.40 |
| May 31, 2023 | 141.50 |
| April 30, 2023 | 141.50 |
| March 31, 2023 | 140.00 |
| February 28, 2023 | 140.60 |
| January 31, 2023 | 140.40 |
| December 31, 2022 | 142.20 |
| November 30, 2022 | 142.60 |
| October 31, 2022 | 142.60 |
| September 30, 2022 | 143.60 |
| August 31, 2022 | 143.60 |
| July 31, 2022 | 143.60 |
| June 30, 2022 | 143.60 |
| May 31, 2022 | 143.60 |
| April 30, 2022 | 142.40 |
| March 31, 2022 | 141.10 |
News
Headline
Time (ET)
05/15 07:05
05/14 11:11
05/14 07:24
Basic Info
|
Manitoba New Housing Price Index is at a current level of 147.80, up from 146.10 last month and up from 142.50 one year ago. This is a change of 1.16% from last month and 3.72% from one year ago. |
| Report | Canada New Housing Price Index |
| Category | House Prices |
| Region | Manitoba |
| Source | Statistics Canada |
Stats
| Last Value | 147.80 |
| Latest Period | Apr 2026 |
| Last Updated | May 19 2026, 09:34 EDT |
| Next Release | Jun 17 2026, 09:30 EDT |
| Average Growth Rate | 3.63% |
| Value from Last Month | 146.10 |
| Change from Last Month | 1.16% |
| Value from 1 Year Ago | 142.50 |
| Change from 1 Year Ago | 3.72% |
| Frequency | Monthly |
| Unit | Index December 2016=100 |
| Adjustment | Not Seasonally Adjusted |
| Download Source File |