

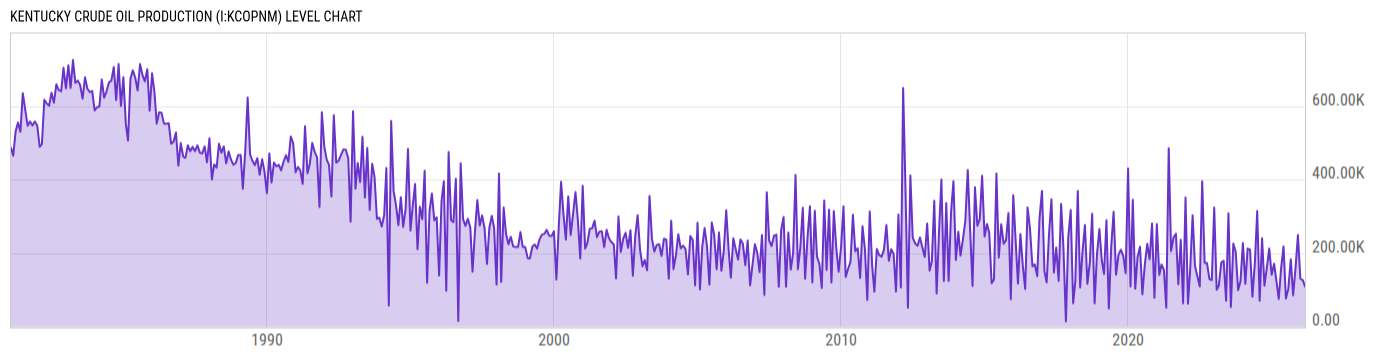
Kentucky Crude Oil Production (I:KCOPNM)
109.00K bbl for Feb 2026
Level Chart
Basic Info
|
Kentucky Crude Oil Production is at a current level of 109.00K, down from 126.00K last month and down from 126.00K one year ago. This is a change of -13.49% from last month and -13.49% from one year ago. |
| Report | Crude Oil Production |
| Category | Energy |
| Region | Kentucky |
| Source | Energy Information Administration |
Stats
| Last Value | 109.00K |
| Latest Period | Feb 2026 |
| Last Updated | Apr 30 2026, 15:34 EDT |
| Next Release | May 29 2026, 15:30 EDT |
| Average Growth Rate | 338.2% |
| Value from Last Month | 126.00K |
| Change from Last Month | -13.49% |
| Value from 1 Year Ago | 126.00K |
| Change from 1 Year Ago | -13.49% |
| Frequency | Monthly |
| Unit | Barrels |
| Adjustment | N/A |
| Download Source File |
Historical Data
| Date | Value |
|---|---|
| February 28, 2026 | 109.00K |
| January 31, 2026 | 126.00K |
| December 31, 2025 | 130.00K |
| November 30, 2025 | 249.00K |
| October 31, 2025 | 160.00K |
| September 30, 2025 | 85.00K |
| August 31, 2025 | 183.00K |
| July 31, 2025 | 103.00K |
| June 30, 2025 | 76.00K |
| May 31, 2025 | 218.00K |
| April 30, 2025 | 158.00K |
| March 31, 2025 | 75.00K |
| February 28, 2025 | 126.00K |
| January 31, 2025 | 171.00K |
| December 31, 2024 | 141.00K |
| November 30, 2024 | 212.00K |
| October 31, 2024 | 161.00K |
| September 30, 2024 | 111.00K |
| August 31, 2024 | 240.00K |
| July 31, 2024 | 70.00K |
| June 30, 2024 | 314.00K |
| May 31, 2024 | 173.00K |
| April 30, 2024 | 81.00K |
| March 31, 2024 | 209.00K |
| February 29, 2024 | 212.00K |
| Date | Value |
|---|---|
| January 31, 2024 | 116.00K |
| December 31, 2023 | 227.00K |
| November 30, 2023 | 123.00K |
| October 31, 2023 | 99.00K |
| September 30, 2023 | 204.00K |
| August 31, 2023 | 226.00K |
| July 31, 2023 | 53.00K |
| June 30, 2023 | 308.00K |
| May 31, 2023 | 70.00K |
| April 30, 2023 | 179.00K |
| March 31, 2023 | 174.00K |
| February 28, 2023 | 112.00K |
| January 31, 2023 | 100.00K |
| December 31, 2022 | 324.00K |
| November 30, 2022 | 126.00K |
| October 31, 2022 | 129.00K |
| September 30, 2022 | 173.00K |
| August 31, 2022 | 173.00K |
| July 31, 2022 | 395.00K |
| June 30, 2022 | 109.00K |
| May 31, 2022 | 137.00K |
| April 30, 2022 | 165.00K |
| March 31, 2022 | 303.00K |
| February 28, 2022 | 155.00K |
| January 31, 2022 | 62.00K |
News
Headline
Time (ET)
05/13 14:39
05/06 06:06
05/05 05:55
Basic Info
|
Kentucky Crude Oil Production is at a current level of 109.00K, down from 126.00K last month and down from 126.00K one year ago. This is a change of -13.49% from last month and -13.49% from one year ago. |
| Report | Crude Oil Production |
| Category | Energy |
| Region | Kentucky |
| Source | Energy Information Administration |
Stats
| Last Value | 109.00K |
| Latest Period | Feb 2026 |
| Last Updated | Apr 30 2026, 15:34 EDT |
| Next Release | May 29 2026, 15:30 EDT |
| Average Growth Rate | 338.2% |
| Value from Last Month | 126.00K |
| Change from Last Month | -13.49% |
| Value from 1 Year Ago | 126.00K |
| Change from 1 Year Ago | -13.49% |
| Frequency | Monthly |
| Unit | Barrels |
| Adjustment | N/A |
| Download Source File |