

Iran Crude Oil Production (I:ICOPD2K2)
3.85M bbl/d for Mar 2026
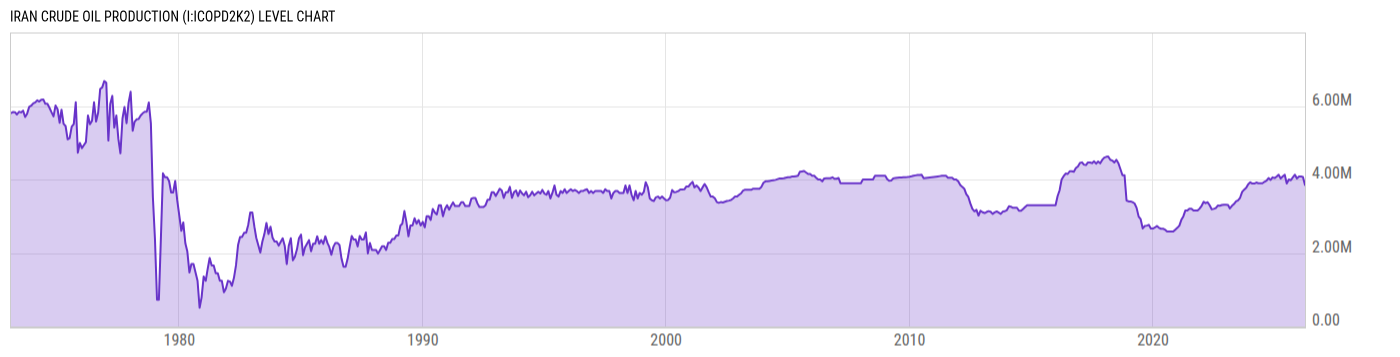
Level Chart
Basic Info
|
Iran Crude Oil Production is at a current level of 3.85M, down from 4.07M last month and down from 4.03M one year ago. This is a change of -5.41% from last month and -4.47% from one year ago. |
| Report | International Energy Statistics |
| Category | Energy |
| Region | Iran |
| Source | Energy Information Administration |
Stats
| Last Value | 3.85M |
| Latest Period | Mar 2026 |
| Last Updated | Jul 28 2026, 14:05 EDT |
| Next Release | Aug 26 2026, 14:00 EDT (E) |
| Average Growth Rate | 6.26% |
| Value from Last Month | 4.07M |
| Change from Last Month | -5.41% |
| Value from 1 Year Ago | 4.03M |
| Change from 1 Year Ago | -4.47% |
| Frequency | Monthly |
| Unit | Barrels per Day |
| Adjustment | N/A |
| Download Source File |
Historical Data
| Date | Value |
|---|---|
| March 31, 2026 | 3.85M |
| February 28, 2026 | 4.07M |
| January 31, 2026 | 4.08M |
| December 31, 2025 | 4.08M |
| November 30, 2025 | 4.03M |
| October 31, 2025 | 4.13M |
| September 30, 2025 | 4.06M |
| August 31, 2025 | 3.98M |
| July 31, 2025 | 4.00M |
| June 30, 2025 | 3.89M |
| May 31, 2025 | 4.13M |
| April 30, 2025 | 4.08M |
| March 31, 2025 | 4.03M |
| February 28, 2025 | 4.13M |
| January 31, 2025 | 4.08M |
| December 31, 2024 | 4.038M |
| November 30, 2024 | 4.058M |
| October 31, 2024 | 3.988M |
| September 30, 2024 | 4.038M |
| August 31, 2024 | 3.968M |
| July 31, 2024 | 3.938M |
| June 30, 2024 | 3.898M |
| May 31, 2024 | 3.898M |
| April 30, 2024 | 3.898M |
| March 31, 2024 | 3.918M |
| Date | Value |
|---|---|
| February 29, 2024 | 3.888M |
| January 31, 2024 | 3.888M |
| December 31, 2023 | 3.923M |
| November 30, 2023 | 3.873M |
| October 31, 2023 | 3.773M |
| September 30, 2023 | 3.723M |
| August 31, 2023 | 3.663M |
| July 31, 2023 | 3.503M |
| June 30, 2023 | 3.433M |
| May 31, 2023 | 3.403M |
| April 30, 2023 | 3.333M |
| March 31, 2023 | 3.283M |
| February 28, 2023 | 3.213M |
| January 31, 2023 | 3.308M |
| December 31, 2022 | 3.315M |
| November 30, 2022 | 3.315M |
| October 31, 2022 | 3.305M |
| September 30, 2022 | 3.285M |
| August 31, 2022 | 3.291M |
| July 31, 2022 | 3.221M |
| June 30, 2022 | 3.201M |
| May 31, 2022 | 3.189M |
| April 30, 2022 | 3.300M |
| March 31, 2022 | 3.380M |
| February 28, 2022 | 3.356M |
News
Headline
Time (ET)
07/24 09:26
07/21 15:56
07/13 15:38
07/02 15:54
Basic Info
|
Iran Crude Oil Production is at a current level of 3.85M, down from 4.07M last month and down from 4.03M one year ago. This is a change of -5.41% from last month and -4.47% from one year ago. |
| Report | International Energy Statistics |
| Category | Energy |
| Region | Iran |
| Source | Energy Information Administration |
Stats
| Last Value | 3.85M |
| Latest Period | Mar 2026 |
| Last Updated | Jul 28 2026, 14:05 EDT |
| Next Release | Aug 26 2026, 14:00 EDT (E) |
| Average Growth Rate | 6.26% |
| Value from Last Month | 4.07M |
| Change from Last Month | -5.41% |
| Value from 1 Year Ago | 4.03M |
| Change from 1 Year Ago | -4.47% |
| Frequency | Monthly |
| Unit | Barrels per Day |
| Adjustment | N/A |
| Download Source File |