

Intel Corp (INTC) - Client Computing Group Operating Income (DISCONTINUED) (I:ICINTCNQ)
Level Chart
Basic Info
|
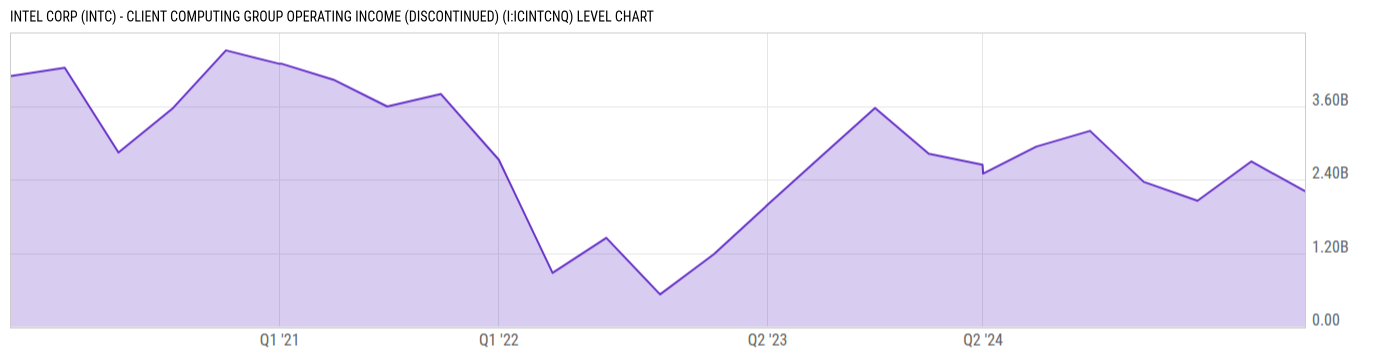
Intel Corp (INTC) - Client Computing Group Operating Income is at a current level of 2.209B, down from 2.694B last quarter and down from 2.937B one year ago. This is a change of -18.00% from last quarter and -24.79% from one year ago. |
|
Intel Corp Client Computing Group Operating Income represents the financial performance of the business segment responsible for producing and selling computing-related products for consumers and businesses. |
| Report | Fiscal.ai |
| Category | Segments & KPIs |
| Region | United States |
| Source | Fiscal.ai |
|
Data provided via Fiscal.ai |
Stats
| Last Value | 2.209B |
| Latest Period | Dec 2025 |
| Last Updated | Jan 30 2026, 08:33 EST |
| Average Growth Rate | 21.72% |
| Value from Last Quarter | 2.694B |
| Change from Last Quarter | -18.00% |
| Value from 1 Year Ago | 2.937B |
| Change from 1 Year Ago | -24.79% |
| Frequency | Quarterly |
| Unit | USD |
| Adjustment | N/A |
| Download Source File |
Historical Data
| Date | Value |
|---|---|
| December 27, 2025 | 2.209B |
| September 27, 2025 | 2.694B |
| June 28, 2025 | 2.053B |
| March 29, 2025 | 2.361B |
| December 28, 2024 | 3.194B |
| September 28, 2024 | 2.937B |
| June 30, 2024 | 2.497B |
| June 29, 2024 | 2.641B |
| March 30, 2024 | 2.822B |
| December 30, 2023 | 3.567B |
| September 30, 2023 | 2.78B |
| July 01, 2023 | 1.986B |
| April 01, 2023 | 1.18B |
| December 31, 2022 | 524.00M |
| Date | Value |
|---|---|
| October 01, 2022 | 1.447B |
| July 02, 2022 | 876.00M |
| April 02, 2022 | 2.722B |
| December 25, 2021 | 3.795B |
| September 25, 2021 | 3.592B |
| June 26, 2021 | 4.029B |
| March 31, 2021 | 4.288B |
| March 27, 2021 | 4.288B |
| December 26, 2020 | 4.508B |
| September 26, 2020 | 3.554B |
| June 27, 2020 | 2.842B |
| March 28, 2020 | 4.225B |
| December 28, 2019 | 4.088B |
News
Basic Info
|
Intel Corp (INTC) - Client Computing Group Operating Income is at a current level of 2.209B, down from 2.694B last quarter and down from 2.937B one year ago. This is a change of -18.00% from last quarter and -24.79% from one year ago. |
|
Intel Corp Client Computing Group Operating Income represents the financial performance of the business segment responsible for producing and selling computing-related products for consumers and businesses. |
| Report | Fiscal.ai |
| Category | Segments & KPIs |
| Region | United States |
| Source | Fiscal.ai |
|
Data provided via Fiscal.ai |
Stats
| Last Value | 2.209B |
| Latest Period | Dec 2025 |
| Last Updated | Jan 30 2026, 08:33 EST |
| Average Growth Rate | 21.72% |
| Value from Last Quarter | 2.694B |
| Change from Last Quarter | -18.00% |
| Value from 1 Year Ago | 2.937B |
| Change from 1 Year Ago | -24.79% |
| Frequency | Quarterly |
| Unit | USD |
| Adjustment | N/A |
| Download Source File |