

US Industrial Production MoM (I:USCIPI)
0.08% for Jun 2026
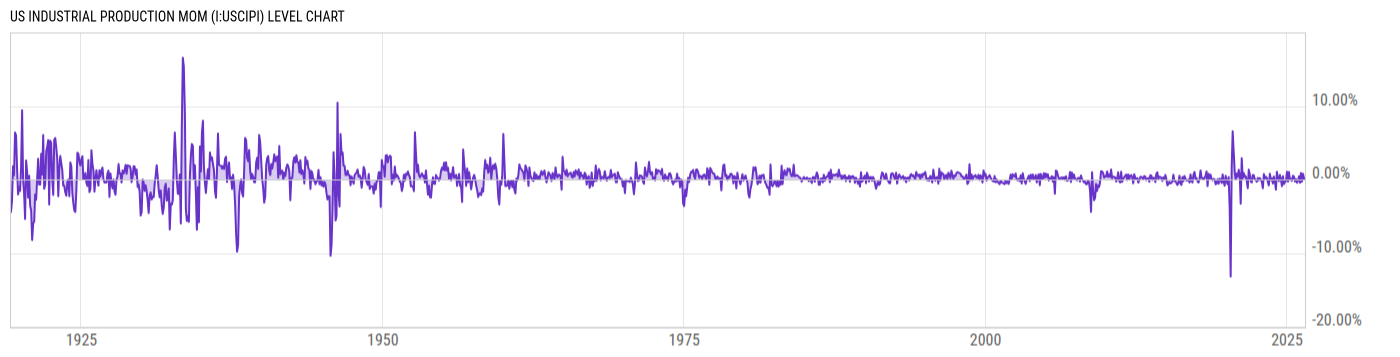
Level Chart
Basic Info
|
US Industrial Production MoM is at 0.08%, compared to 0.14% last month and 0.51% last year. This is lower than the long term average of 0.25%. |
| Report | G.17 Industrial Production and Capacity Utilization |
| Category | Manufacturing Business Statistics |
| Region | United States |
| Source | Federal Reserve |
Stats
| Last Value | 0.08% |
| Latest Period | Jun 2026 |
| Last Updated | Jul 17 2026, 09:15 EDT |
| Next Release | Aug 18 2026, 09:15 EDT |
| Long Term Average | 0.25% |
| Average Growth Rate | -101.1% |
| Value from Last Month | 0.14% |
| Change from Last Month | -44.15% |
| Value from 1 Year Ago | 0.51% |
| Change from 1 Year Ago | -84.87% |
| Frequency | Monthly |
| Unit | Percent |
| Adjustment | Seasonally Adjusted |
| Download Source File |
Historical Data
| Date | Value |
|---|---|
| June 30, 2026 | 0.08% |
| May 31, 2026 | 0.14% |
| April 30, 2026 | 0.79% |
| March 31, 2026 | -0.30% |
| February 28, 2026 | 0.88% |
| January 31, 2026 | -0.45% |
| December 31, 2025 | 0.46% |
| November 30, 2025 | -0.18% |
| October 31, 2025 | -0.44% |
| September 30, 2025 | 0.04% |
| August 31, 2025 | -0.26% |
| July 31, 2025 | 0.41% |
| June 30, 2025 | 0.51% |
| May 31, 2025 | -0.16% |
| April 30, 2025 | 0.09% |
| March 31, 2025 | -0.06% |
| February 28, 2025 | 1.03% |
| January 31, 2025 | -0.26% |
| December 31, 2024 | 1.04% |
| November 30, 2024 | -0.18% |
| October 31, 2024 | -0.34% |
| September 30, 2024 | -0.62% |
| August 31, 2024 | 0.46% |
| July 31, 2024 | -0.91% |
| June 30, 2024 | 0.03% |
| Date | Value |
|---|---|
| May 31, 2024 | 0.62% |
| April 30, 2024 | -0.21% |
| March 31, 2024 | 0.17% |
| February 29, 2024 | 1.07% |
| January 31, 2024 | -1.37% |
| December 31, 2023 | -0.26% |
| November 30, 2023 | 0.39% |
| October 31, 2023 | -0.55% |
| September 30, 2023 | 0.18% |
| August 31, 2023 | -0.07% |
| July 31, 2023 | 0.79% |
| June 30, 2023 | -0.80% |
| May 31, 2023 | -0.32% |
| April 30, 2023 | 0.23% |
| March 31, 2023 | 0.38% |
| February 28, 2023 | 0.14% |
| January 31, 2023 | 0.74% |
| December 31, 2022 | -1.18% |
| November 30, 2022 | -0.29% |
| October 31, 2022 | -0.04% |
| September 30, 2022 | 0.19% |
| August 31, 2022 | -0.13% |
| July 31, 2022 | 0.20% |
| June 30, 2022 | -0.31% |
| May 31, 2022 | -0.10% |
News
Headline
Time (ET)
07/24 13:30
07/23 08:53
07/21 13:47
07/02 16:13
Basic Info
|
US Industrial Production MoM is at 0.08%, compared to 0.14% last month and 0.51% last year. This is lower than the long term average of 0.25%. |
| Report | G.17 Industrial Production and Capacity Utilization |
| Category | Manufacturing Business Statistics |
| Region | United States |
| Source | Federal Reserve |
Stats
| Last Value | 0.08% |
| Latest Period | Jun 2026 |
| Last Updated | Jul 17 2026, 09:15 EDT |
| Next Release | Aug 18 2026, 09:15 EDT |
| Long Term Average | 0.25% |
| Average Growth Rate | -101.1% |
| Value from Last Month | 0.14% |
| Change from Last Month | -44.15% |
| Value from 1 Year Ago | 0.51% |
| Change from 1 Year Ago | -84.87% |
| Frequency | Monthly |
| Unit | Percent |
| Adjustment | Seasonally Adjusted |
| Download Source File |