

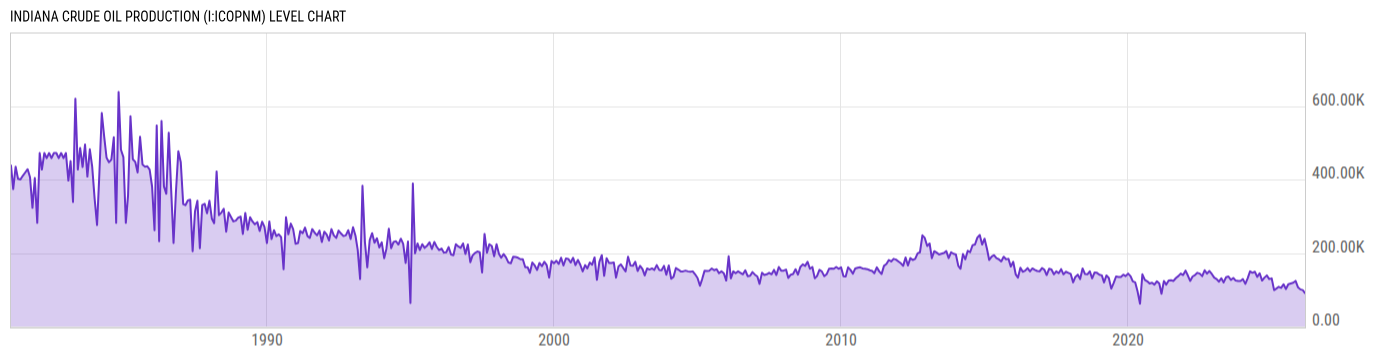
Indiana Crude Oil Production (I:ICOPNM)
91.00K bbl for Feb 2026
Level Chart
Basic Info
|
Indiana Crude Oil Production is at a current level of 91.00K, down from 99.00K last month and down from 103.00K one year ago. This is a change of -8.08% from last month and -11.65% from one year ago. |
| Report | Crude Oil Production |
| Category | Energy |
| Region | Indiana |
| Source | Energy Information Administration |
Stats
| Last Value | 91.00K |
| Latest Period | Feb 2026 |
| Last Updated | Apr 30 2026, 15:34 EDT |
| Next Release | May 29 2026, 15:30 EDT |
| Average Growth Rate | 25.55% |
| Value from Last Month | 99.00K |
| Change from Last Month | -8.08% |
| Value from 1 Year Ago | 103.00K |
| Change from 1 Year Ago | -11.65% |
| Frequency | Monthly |
| Unit | Barrels |
| Adjustment | N/A |
| Download Source File |
Historical Data
| Date | Value |
|---|---|
| February 28, 2026 | 91.00K |
| January 31, 2026 | 99.00K |
| December 31, 2025 | 101.00K |
| November 30, 2025 | 107.00K |
| October 31, 2025 | 124.00K |
| September 30, 2025 | 119.00K |
| August 31, 2025 | 117.00K |
| July 31, 2025 | 115.00K |
| June 30, 2025 | 102.00K |
| May 31, 2025 | 115.00K |
| April 30, 2025 | 105.00K |
| March 31, 2025 | 108.00K |
| February 28, 2025 | 103.00K |
| January 31, 2025 | 99.00K |
| December 31, 2024 | 131.00K |
| November 30, 2024 | 129.00K |
| October 31, 2024 | 139.00K |
| September 30, 2024 | 133.00K |
| August 31, 2024 | 125.00K |
| July 31, 2024 | 145.00K |
| June 30, 2024 | 135.00K |
| May 31, 2024 | 149.00K |
| April 30, 2024 | 146.00K |
| March 31, 2024 | 150.00K |
| February 29, 2024 | 131.00K |
| Date | Value |
|---|---|
| January 31, 2024 | 116.00K |
| December 31, 2023 | 129.00K |
| November 30, 2023 | 124.00K |
| October 31, 2023 | 124.00K |
| September 30, 2023 | 125.00K |
| August 31, 2023 | 132.00K |
| July 31, 2023 | 127.00K |
| June 30, 2023 | 136.00K |
| May 31, 2023 | 134.00K |
| April 30, 2023 | 120.00K |
| March 31, 2023 | 131.00K |
| February 28, 2023 | 122.00K |
| January 31, 2023 | 129.00K |
| December 31, 2022 | 133.00K |
| November 30, 2022 | 143.00K |
| October 31, 2022 | 151.00K |
| September 30, 2022 | 144.00K |
| August 31, 2022 | 153.00K |
| July 31, 2022 | 137.00K |
| June 30, 2022 | 144.00K |
| May 31, 2022 | 146.00K |
| April 30, 2022 | 140.00K |
| March 31, 2022 | 136.00K |
| February 28, 2022 | 124.00K |
| January 31, 2022 | 138.00K |
News
Headline
Time (ET)
05/13 14:39
05/06 06:06
05/05 05:55
Basic Info
|
Indiana Crude Oil Production is at a current level of 91.00K, down from 99.00K last month and down from 103.00K one year ago. This is a change of -8.08% from last month and -11.65% from one year ago. |
| Report | Crude Oil Production |
| Category | Energy |
| Region | Indiana |
| Source | Energy Information Administration |
Stats
| Last Value | 91.00K |
| Latest Period | Feb 2026 |
| Last Updated | Apr 30 2026, 15:34 EDT |
| Next Release | May 29 2026, 15:30 EDT |
| Average Growth Rate | 25.55% |
| Value from Last Month | 99.00K |
| Change from Last Month | -8.08% |
| Value from 1 Year Ago | 103.00K |
| Change from 1 Year Ago | -11.65% |
| Frequency | Monthly |
| Unit | Barrels |
| Adjustment | N/A |
| Download Source File |