

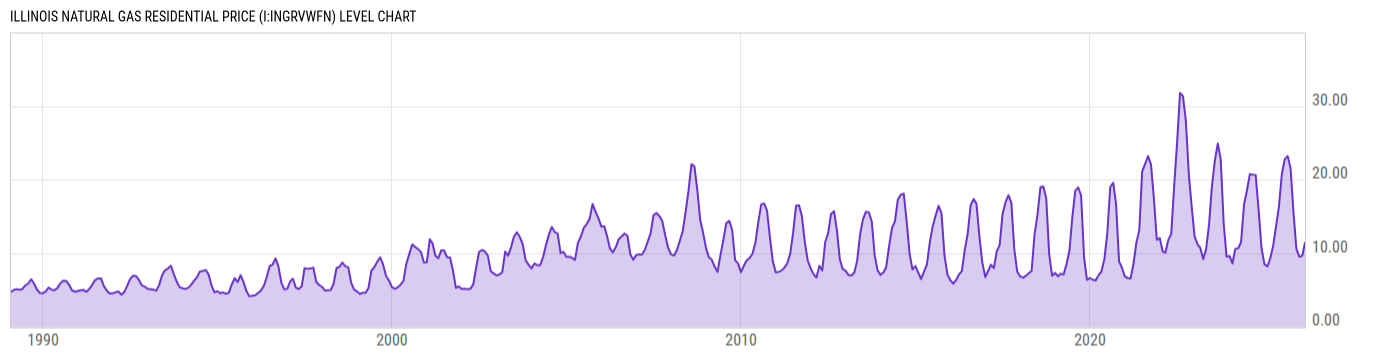
Illinois Natural Gas Residential Price (I:INGRVWFN)
11.40 USD/thou cf for Feb 2026
Level Chart
Basic Info
|
Illinois Natural Gas Residential Price is at a current level of 11.40, up from 9.65 last month and up from 9.22 one year ago. This is a change of 18.13% from last month and 23.64% from one year ago. |
| Report | Natural Gas Monthly |
| Category | Energy |
| Region | Illinois |
| Source | Energy Information Administration |
Stats
| Last Value | 11.40 |
| Latest Period | Feb 2026 |
| Last Updated | May 3 2026, 18:15 EDT |
| Next Release | May 29 2026, 10:30 EDT |
| Average Growth Rate | 19.50% |
| Value from Last Month | 9.65 |
| Change from Last Month | 18.13% |
| Value from 1 Year Ago | 9.22 |
| Change from 1 Year Ago | 23.64% |
| Frequency | Monthly |
| Unit | USD per Thousand Cubic Feet |
| Adjustment | N/A |
| Download Source File |
Historical Data
| Date | Value |
|---|---|
| February 28, 2026 | 11.40 |
| January 31, 2026 | 9.65 |
| December 31, 2025 | 9.48 |
| November 30, 2025 | 10.56 |
| October 31, 2025 | 15.45 |
| September 30, 2025 | 21.51 |
| August 31, 2025 | 23.18 |
| July 31, 2025 | 22.77 |
| June 30, 2025 | 20.67 |
| May 31, 2025 | 16.28 |
| April 30, 2025 | 13.55 |
| March 31, 2025 | 10.91 |
| February 28, 2025 | 9.22 |
| January 31, 2025 | 8.18 |
| December 31, 2024 | 8.46 |
| November 30, 2024 | 10.68 |
| October 31, 2024 | 15.81 |
| September 30, 2024 | 20.60 |
| August 31, 2024 | 20.65 |
| July 31, 2024 | 20.73 |
| June 30, 2024 | 18.51 |
| May 31, 2024 | 16.60 |
| April 30, 2024 | 11.50 |
| March 31, 2024 | 10.65 |
| February 29, 2024 | 10.56 |
| Date | Value |
|---|---|
| January 31, 2024 | 8.58 |
| December 31, 2023 | 9.60 |
| November 30, 2023 | 9.50 |
| October 31, 2023 | 14.05 |
| September 30, 2023 | 22.74 |
| August 31, 2023 | 24.91 |
| July 31, 2023 | 22.61 |
| June 30, 2023 | 19.10 |
| May 31, 2023 | 13.89 |
| April 30, 2023 | 10.53 |
| March 31, 2023 | 9.18 |
| February 28, 2023 | 10.71 |
| January 31, 2023 | 11.18 |
| December 31, 2022 | 12.24 |
| November 30, 2022 | 16.31 |
| October 31, 2022 | 20.73 |
| September 30, 2022 | 28.00 |
| August 31, 2022 | 31.33 |
| July 31, 2022 | 31.77 |
| June 30, 2022 | 24.91 |
| May 31, 2022 | 19.15 |
| April 30, 2022 | 12.57 |
| March 31, 2022 | 11.79 |
| February 28, 2022 | 10.06 |
| January 31, 2022 | 10.21 |
News
Headline
Time (ET)
05/07 09:33
04/30 09:31
04/28 09:25
04/10 06:11
Basic Info
|
Illinois Natural Gas Residential Price is at a current level of 11.40, up from 9.65 last month and up from 9.22 one year ago. This is a change of 18.13% from last month and 23.64% from one year ago. |
| Report | Natural Gas Monthly |
| Category | Energy |
| Region | Illinois |
| Source | Energy Information Administration |
Stats
| Last Value | 11.40 |
| Latest Period | Feb 2026 |
| Last Updated | May 3 2026, 18:15 EDT |
| Next Release | May 29 2026, 10:30 EDT |
| Average Growth Rate | 19.50% |
| Value from Last Month | 9.65 |
| Change from Last Month | 18.13% |
| Value from 1 Year Ago | 9.22 |
| Change from 1 Year Ago | 23.64% |
| Frequency | Monthly |
| Unit | USD per Thousand Cubic Feet |
| Adjustment | N/A |
| Download Source File |