

Illinois Natural Gas Industrial Price (I:INGI7BCI)
8.24 USD/thou cf for Mar 2026
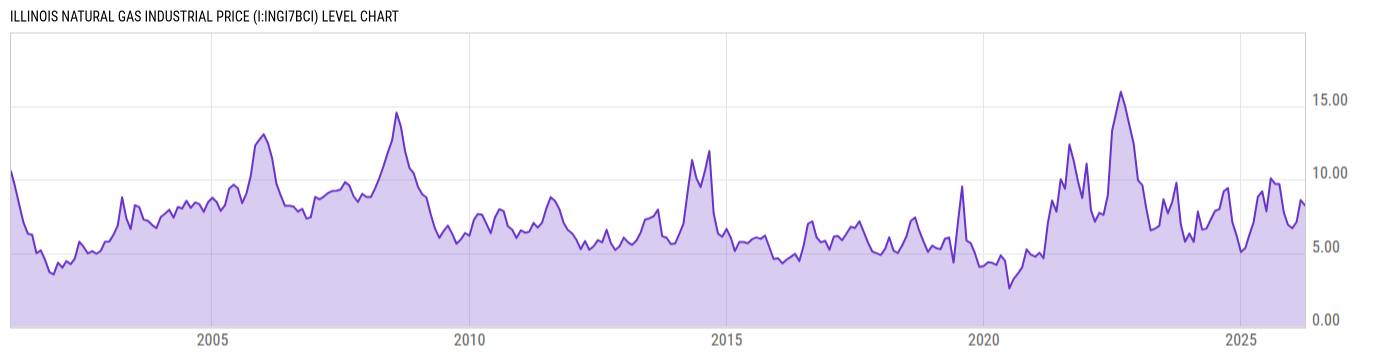
Level Chart
Basic Info
|
Illinois Natural Gas Industrial Price is at a current level of 8.24, down from 8.60 last month and up from 7.09 one year ago. This is a change of -4.19% from last month and 16.22% from one year ago. |
| Report | Natural Gas Monthly |
| Category | Energy |
| Region | Illinois |
| Source | Energy Information Administration |
Stats
| Last Value | 8.24 |
| Latest Period | Mar 2026 |
| Last Updated | May 29 2026, 10:41 EDT |
| Next Release | Jun 30 2026, 10:30 EDT |
| Average Growth Rate | 9.54% |
| Value from Last Month | 8.60 |
| Change from Last Month | -4.19% |
| Value from 1 Year Ago | 7.09 |
| Change from 1 Year Ago | 16.22% |
| Frequency | Monthly |
| Unit | USD per Thousand Cubic Feet |
| Adjustment | N/A |
| Download Source File |
Historical Data
| Date | Value |
|---|---|
| March 31, 2026 | 8.24 |
| February 28, 2026 | 8.60 |
| January 31, 2026 | 7.13 |
| December 31, 2025 | 6.68 |
| November 30, 2025 | 6.92 |
| October 31, 2025 | 7.78 |
| September 30, 2025 | 9.70 |
| August 31, 2025 | 9.70 |
| July 31, 2025 | 10.08 |
| June 30, 2025 | 7.83 |
| May 31, 2025 | 9.20 |
| April 30, 2025 | 8.82 |
| March 31, 2025 | 7.09 |
| February 28, 2025 | 6.20 |
| January 31, 2025 | 5.34 |
| December 31, 2024 | 5.06 |
| November 30, 2024 | 6.20 |
| October 31, 2024 | 7.10 |
| September 30, 2024 | 9.41 |
| August 31, 2024 | 9.20 |
| July 31, 2024 | 7.98 |
| June 30, 2024 | 7.86 |
| May 31, 2024 | 7.28 |
| April 30, 2024 | 6.66 |
| March 31, 2024 | 6.59 |
| Date | Value |
|---|---|
| February 29, 2024 | 7.82 |
| January 31, 2024 | 5.75 |
| December 31, 2023 | 6.33 |
| November 30, 2023 | 5.76 |
| October 31, 2023 | 6.95 |
| September 30, 2023 | 9.78 |
| August 31, 2023 | 8.47 |
| July 31, 2023 | 7.70 |
| June 30, 2023 | 8.66 |
| May 31, 2023 | 6.84 |
| April 30, 2023 | 6.66 |
| March 31, 2023 | 6.54 |
| February 28, 2023 | 8.02 |
| January 31, 2023 | 9.62 |
| December 31, 2022 | 9.94 |
| November 30, 2022 | 12.45 |
| October 31, 2022 | 13.69 |
| September 30, 2022 | 15.00 |
| August 31, 2022 | 15.97 |
| July 31, 2022 | 14.64 |
| June 30, 2022 | 13.32 |
| May 31, 2022 | 8.95 |
| April 30, 2022 | 7.59 |
| March 31, 2022 | 7.73 |
| February 28, 2022 | 7.13 |
News
Headline
Time (ET)
05/22 06:05
05/21 09:30
05/15 06:06
Basic Info
|
Illinois Natural Gas Industrial Price is at a current level of 8.24, down from 8.60 last month and up from 7.09 one year ago. This is a change of -4.19% from last month and 16.22% from one year ago. |
| Report | Natural Gas Monthly |
| Category | Energy |
| Region | Illinois |
| Source | Energy Information Administration |
Stats
| Last Value | 8.24 |
| Latest Period | Mar 2026 |
| Last Updated | May 29 2026, 10:41 EDT |
| Next Release | Jun 30 2026, 10:30 EDT |
| Average Growth Rate | 9.54% |
| Value from Last Month | 8.60 |
| Change from Last Month | -4.19% |
| Value from 1 Year Ago | 7.09 |
| Change from 1 Year Ago | 16.22% |
| Frequency | Monthly |
| Unit | USD per Thousand Cubic Feet |
| Adjustment | N/A |
| Download Source File |