

Illinois Natural Gas Residential Consumption (I:INGRTDDY)
56.37B cf for Feb 2026
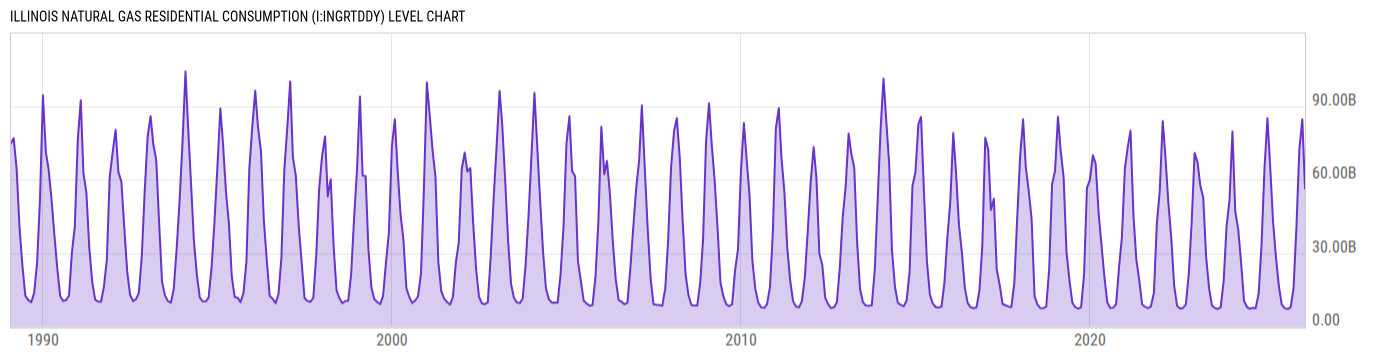
Level Chart
Basic Info
|
Illinois Natural Gas Residential Consumption is at a current level of 56.37B, down from 84.57B last month and down from 65.84B one year ago. This is a change of -33.35% from last month and -14.39% from one year ago. |
| Report | Natural Gas Monthly |
| Category | Energy |
| Region | Illinois |
| Source | Energy Information Administration |
Stats
| Last Value | 56.37B |
| Latest Period | Feb 2026 |
| Last Updated | May 3 2026, 18:15 EDT |
| Next Release | May 29 2026, 10:30 EDT |
| Average Growth Rate | 145.8% |
| Value from Last Month | 84.57B |
| Change from Last Month | -33.35% |
| Value from 1 Year Ago | 65.84B |
| Change from 1 Year Ago | -14.39% |
| Frequency | Monthly |
| Unit | Cubic Feet |
| Adjustment | N/A |
| Download Source File |
Historical Data
| Date | Value |
|---|---|
| February 28, 2026 | 56.37B |
| January 31, 2026 | 84.57B |
| December 31, 2025 | 72.39B |
| November 30, 2025 | 40.24B |
| October 31, 2025 | 15.50B |
| September 30, 2025 | 7.760B |
| August 31, 2025 | 7.140B |
| July 31, 2025 | 7.487B |
| June 30, 2025 | 8.910B |
| May 31, 2025 | 16.32B |
| April 30, 2025 | 28.25B |
| March 31, 2025 | 42.65B |
| February 28, 2025 | 65.84B |
| January 31, 2025 | 85.02B |
| December 31, 2024 | 64.51B |
| November 30, 2024 | 33.20B |
| October 31, 2024 | 13.47B |
| September 30, 2024 | 7.488B |
| August 31, 2024 | 7.642B |
| July 31, 2024 | 7.213B |
| June 30, 2024 | 8.035B |
| May 31, 2024 | 10.39B |
| April 30, 2024 | 26.17B |
| March 31, 2024 | 39.74B |
| February 29, 2024 | 47.01B |
| Date | Value |
|---|---|
| January 31, 2024 | 79.60B |
| December 31, 2023 | 51.71B |
| November 30, 2023 | 40.83B |
| October 31, 2023 | 18.62B |
| September 30, 2023 | 7.881B |
| August 31, 2023 | 7.170B |
| July 31, 2023 | 7.517B |
| June 30, 2023 | 8.589B |
| May 31, 2023 | 15.65B |
| April 30, 2023 | 28.50B |
| March 31, 2023 | 52.63B |
| February 28, 2023 | 57.62B |
| January 31, 2023 | 66.90B |
| December 31, 2022 | 70.86B |
| November 30, 2022 | 42.47B |
| October 31, 2022 | 21.58B |
| September 30, 2022 | 8.941B |
| August 31, 2022 | 7.563B |
| July 31, 2022 | 7.309B |
| June 30, 2022 | 8.532B |
| May 31, 2022 | 16.59B |
| April 30, 2022 | 36.46B |
| March 31, 2022 | 50.55B |
| February 28, 2022 | 69.56B |
| January 31, 2022 | 83.89B |
News
Headline
Time (ET)
05/07 09:33
04/30 09:31
04/28 09:25
04/10 06:11
Basic Info
|
Illinois Natural Gas Residential Consumption is at a current level of 56.37B, down from 84.57B last month and down from 65.84B one year ago. This is a change of -33.35% from last month and -14.39% from one year ago. |
| Report | Natural Gas Monthly |
| Category | Energy |
| Region | Illinois |
| Source | Energy Information Administration |
Stats
| Last Value | 56.37B |
| Latest Period | Feb 2026 |
| Last Updated | May 3 2026, 18:15 EDT |
| Next Release | May 29 2026, 10:30 EDT |
| Average Growth Rate | 145.8% |
| Value from Last Month | 84.57B |
| Change from Last Month | -33.35% |
| Value from 1 Year Ago | 65.84B |
| Change from 1 Year Ago | -14.39% |
| Frequency | Monthly |
| Unit | Cubic Feet |
| Adjustment | N/A |
| Download Source File |