

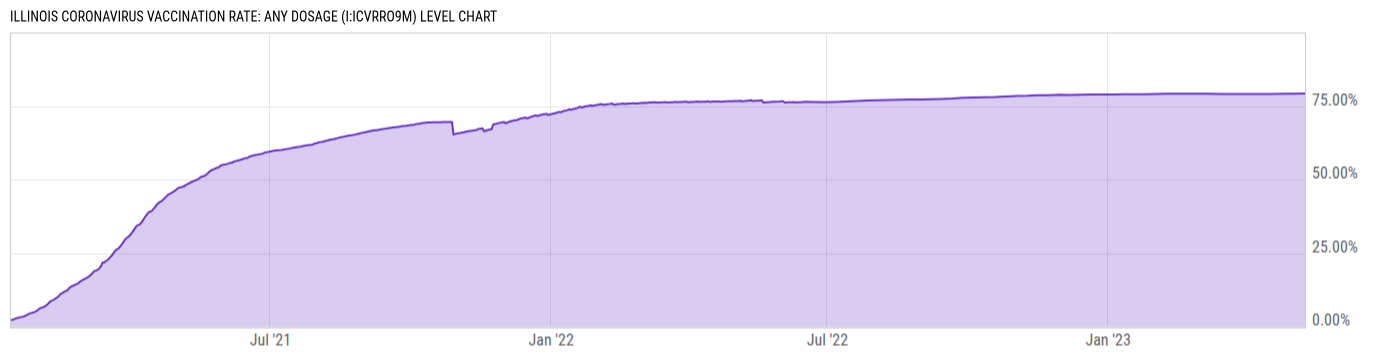
Illinois Coronavirus Vaccination Rate: Any Dosage (I:ICVRRO9M)
79.21% for May 10 2023
Level Chart
Basic Info
|
Illinois Coronavirus Vaccination Rate: Any Dosage is at 79.21%, compared to 79.17% yesterday and 76.77% last year. This is higher than the long term average of 59.96%. |
| Report | Coronavirus (COVID-19) Vaccinations |
| Category | Public Health |
| Region | Illinois |
| Source | Our World in Data |
Stats
| Last Value | 79.21% |
| Latest Period | May 10 2023 |
| Last Updated | May 14 2023, 20:01 EDT |
| Next Release | May 22 2026, 18:00 EDT (E) |
| Long Term Average | 59.96% |
| Average Growth Rate | 249.8% |
| Value from Yesterday | 79.17% |
| Change from Yesterday | 0.05% |
| Value from 1 Year Ago | 76.77% |
| Change from 1 Year Ago | 3.18% |
| Frequency | Daily |
| Unit | Percent |
| Adjustment | N/A |
| Download Source File | |
| Notes | Includes any person that has received at least one dose of Coronavirus vaccine as some vaccines require 2 doses. |
Historical Data
| Date | Value |
|---|---|
| May 10, 2023 | 79.21% |
| May 03, 2023 | 79.17% |
| April 26, 2023 | 79.15% |
| April 19, 2023 | 79.12% |
| April 12, 2023 | 79.10% |
| April 05, 2023 | 79.12% |
| March 29, 2023 | 79.12% |
| March 22, 2023 | 79.09% |
| March 15, 2023 | 79.09% |
| March 08, 2023 | 79.15% |
| March 01, 2023 | 79.19% |
| February 22, 2023 | 79.18% |
| February 15, 2023 | 79.16% |
| February 08, 2023 | 79.14% |
| February 01, 2023 | 79.05% |
| January 25, 2023 | 78.96% |
| January 18, 2023 | 79.00% |
| January 11, 2023 | 78.99% |
| January 04, 2023 | 78.87% |
| December 28, 2022 | 78.90% |
| December 21, 2022 | 78.88% |
| December 14, 2022 | 78.84% |
| December 07, 2022 | 78.75% |
| November 30, 2022 | 78.81% |
| November 23, 2022 | 78.67% |
| Date | Value |
|---|---|
| November 16, 2022 | 78.68% |
| November 09, 2022 | 78.51% |
| November 02, 2022 | 78.43% |
| October 26, 2022 | 78.24% |
| October 19, 2022 | 78.07% |
| October 12, 2022 | 78.00% |
| October 05, 2022 | 77.93% |
| September 28, 2022 | 77.78% |
| September 21, 2022 | 77.53% |
| September 14, 2022 | 77.37% |
| September 07, 2022 | 77.28% |
| August 31, 2022 | 77.23% |
| August 24, 2022 | 77.17% |
| August 17, 2022 | 77.14% |
| August 10, 2022 | 77.08% |
| August 03, 2022 | 76.93% |
| July 27, 2022 | 76.83% |
| July 20, 2022 | 76.67% |
| July 13, 2022 | 76.51% |
| July 06, 2022 | 76.40% |
| June 29, 2022 | 76.28% |
| June 22, 2022 | 76.33% |
| June 16, 2022 | 76.41% |
| June 15, 2022 | 76.38% |
| June 14, 2022 | 76.31% |
News
Headline
Time (ET)
04/21 19:01
Basic Info
|
Illinois Coronavirus Vaccination Rate: Any Dosage is at 79.21%, compared to 79.17% yesterday and 76.77% last year. This is higher than the long term average of 59.96%. |
| Report | Coronavirus (COVID-19) Vaccinations |
| Category | Public Health |
| Region | Illinois |
| Source | Our World in Data |
Stats
| Last Value | 79.21% |
| Latest Period | May 10 2023 |
| Last Updated | May 14 2023, 20:01 EDT |
| Next Release | May 22 2026, 18:00 EDT (E) |
| Long Term Average | 59.96% |
| Average Growth Rate | 249.8% |
| Value from Yesterday | 79.17% |
| Change from Yesterday | 0.05% |
| Value from 1 Year Ago | 76.77% |
| Change from 1 Year Ago | 3.18% |
| Frequency | Daily |
| Unit | Percent |
| Adjustment | N/A |
| Download Source File | |
| Notes | Includes any person that has received at least one dose of Coronavirus vaccine as some vaccines require 2 doses. |