

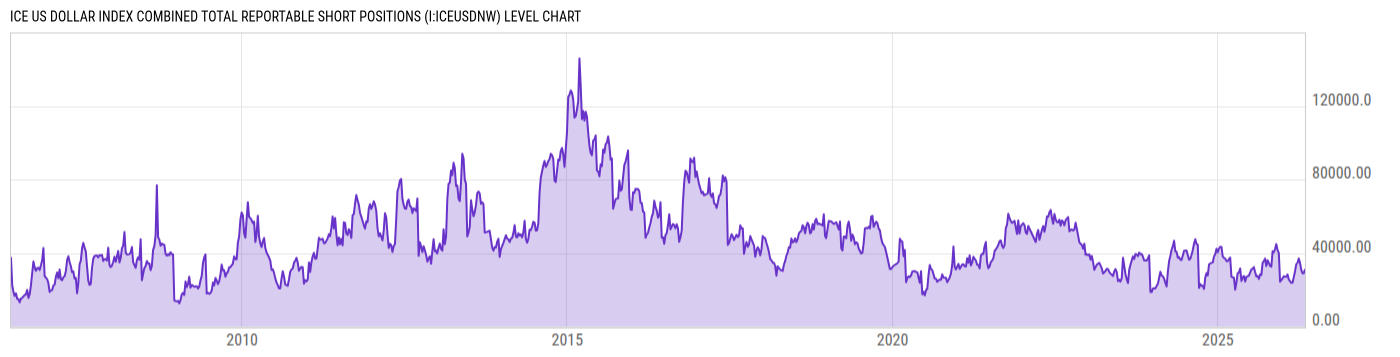
ICE US Dollar Index Combined Total Reportable Short Positions (I:ICEUSDNW)
40773.00 for Wk of May 26 2026
Level Chart
Basic Info
|
ICE US Dollar Index Combined Total Reportable Short Positions is at a current level of 40773.00, up from 39231.00 last week and up from 26736.00 one year ago. This is a change of 3.93% from last week and 52.50% from one year ago. |
| Report | Commitments of Traders |
| Category | Market Indices and Statistics |
| Region | N/A |
| Source | US Commodity Futures Trading Commission |
Stats
| Last Value | 40773.00 |
| Latest Period | May 26 2026 |
| Last Updated | May 29 2026, 15:36 EDT |
| Next Release | Jun 5 2026, 15:30 EDT |
| Average Growth Rate | 37.69% |
| Value from Last Week | 39231.00 |
| Change from Last Week | 3.93% |
| Value from 1 Year Ago | 26736.00 |
| Change from 1 Year Ago | 52.50% |
| Frequency | Weekly |
| Adjustment | N/A |
| Download Source File |
Historical Data
| Date | Value |
|---|---|
| May 26, 2026 | 40773.00 |
| May 19, 2026 | 39231.00 |
| May 12, 2026 | 31099.00 |
| May 05, 2026 | 30919.00 |
| April 28, 2026 | 29039.00 |
| April 21, 2026 | 28954.00 |
| April 14, 2026 | 30793.00 |
| April 07, 2026 | 34668.00 |
| March 31, 2026 | 37055.00 |
| March 24, 2026 | 34622.00 |
| March 17, 2026 | 33943.00 |
| March 10, 2026 | 30086.00 |
| March 03, 2026 | 26885.00 |
| February 24, 2026 | 23813.00 |
| February 17, 2026 | 23786.00 |
| February 10, 2026 | 24664.00 |
| February 03, 2026 | 25592.00 |
| January 27, 2026 | 28316.00 |
| January 20, 2026 | 27034.00 |
| January 13, 2026 | 27060.00 |
| January 06, 2026 | 27346.00 |
| December 30, 2025 | 26152.00 |
| December 23, 2025 | 25286.00 |
| December 16, 2025 | 24366.00 |
| December 09, 2025 | 40108.00 |
| Date | Value |
|---|---|
| December 02, 2025 | 41581.00 |
| November 25, 2025 | 44836.00 |
| November 18, 2025 | 42129.00 |
| November 10, 2025 | 40341.00 |
| November 04, 2025 | 40970.00 |
| October 28, 2025 | 32524.00 |
| October 21, 2025 | 32985.00 |
| October 14, 2025 | 34635.00 |
| October 07, 2025 | 36041.00 |
| September 30, 2025 | 32907.00 |
| September 23, 2025 | 36964.00 |
| September 16, 2025 | 35532.00 |
| September 09, 2025 | 34686.00 |
| September 02, 2025 | 28068.00 |
| August 26, 2025 | 28358.00 |
| August 19, 2025 | 25909.00 |
| August 12, 2025 | 27447.00 |
| August 05, 2025 | 27264.00 |
| July 29, 2025 | 29486.00 |
| July 22, 2025 | 32306.00 |
| July 15, 2025 | 31412.00 |
| July 08, 2025 | 31114.00 |
| July 01, 2025 | 32231.00 |
| June 24, 2025 | 27748.00 |
| June 17, 2025 | 26650.00 |
News
Headline
Time (ET)
05/29 07:59
05/26 08:53
05/22 07:53
05/20 06:48
Basic Info
|
ICE US Dollar Index Combined Total Reportable Short Positions is at a current level of 40773.00, up from 39231.00 last week and up from 26736.00 one year ago. This is a change of 3.93% from last week and 52.50% from one year ago. |
| Report | Commitments of Traders |
| Category | Market Indices and Statistics |
| Region | N/A |
| Source | US Commodity Futures Trading Commission |
Stats
| Last Value | 40773.00 |
| Latest Period | May 26 2026 |
| Last Updated | May 29 2026, 15:36 EDT |
| Next Release | Jun 5 2026, 15:30 EDT |
| Average Growth Rate | 37.69% |
| Value from Last Week | 39231.00 |
| Change from Last Week | 3.93% |
| Value from 1 Year Ago | 26736.00 |
| Change from 1 Year Ago | 52.50% |
| Frequency | Weekly |
| Adjustment | N/A |
| Download Source File |