

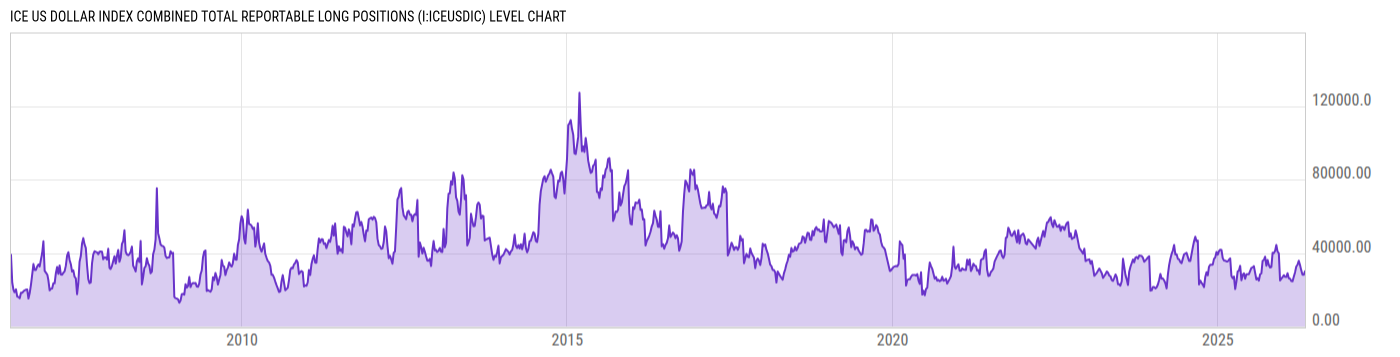
ICE US Dollar Index Combined Total Reportable Long Positions (I:ICEUSDIC)
39204.00 for Wk of May 26 2026
Level Chart
Basic Info
|
ICE US Dollar Index Combined Total Reportable Long Positions is at a current level of 39204.00, up from 37194.00 last week and up from 28049.00 one year ago. This is a change of 5.40% from last week and 39.77% from one year ago. |
| Report | Commitments of Traders |
| Category | Market Indices and Statistics |
| Region | N/A |
| Source | US Commodity Futures Trading Commission |
Stats
| Last Value | 39204.00 |
| Latest Period | May 26 2026 |
| Last Updated | May 29 2026, 15:36 EDT |
| Next Release | Jun 5 2026, 15:30 EDT |
| Average Growth Rate | 39.46% |
| Value from Last Week | 37194.00 |
| Change from Last Week | 5.40% |
| Value from 1 Year Ago | 28049.00 |
| Change from 1 Year Ago | 39.77% |
| Frequency | Weekly |
| Adjustment | N/A |
| Download Source File |
Historical Data
| Date | Value |
|---|---|
| May 26, 2026 | 39204.00 |
| May 19, 2026 | 37194.00 |
| May 12, 2026 | 29627.00 |
| May 05, 2026 | 30038.00 |
| April 28, 2026 | 28137.00 |
| April 21, 2026 | 28117.00 |
| April 14, 2026 | 30555.00 |
| April 07, 2026 | 33490.00 |
| March 31, 2026 | 35791.00 |
| March 24, 2026 | 33613.00 |
| March 17, 2026 | 32667.00 |
| March 10, 2026 | 29440.00 |
| March 03, 2026 | 27100.00 |
| February 24, 2026 | 24580.00 |
| February 17, 2026 | 24798.00 |
| February 10, 2026 | 26045.00 |
| February 03, 2026 | 26259.00 |
| January 27, 2026 | 28992.00 |
| January 20, 2026 | 26905.00 |
| January 13, 2026 | 27049.00 |
| January 06, 2026 | 27914.00 |
| December 30, 2025 | 26780.00 |
| December 23, 2025 | 26065.00 |
| December 16, 2025 | 24991.00 |
| December 09, 2025 | 39874.00 |
| Date | Value |
|---|---|
| December 02, 2025 | 40764.00 |
| November 25, 2025 | 44359.00 |
| November 18, 2025 | 41137.00 |
| November 10, 2025 | 39872.00 |
| November 04, 2025 | 40077.00 |
| October 28, 2025 | 32315.00 |
| October 21, 2025 | 32145.00 |
| October 14, 2025 | 33461.00 |
| October 07, 2025 | 36213.00 |
| September 30, 2025 | 33097.00 |
| September 23, 2025 | 38005.00 |
| September 16, 2025 | 36184.00 |
| September 09, 2025 | 35776.00 |
| September 02, 2025 | 28841.00 |
| August 26, 2025 | 28424.00 |
| August 19, 2025 | 24989.00 |
| August 12, 2025 | 26332.00 |
| August 05, 2025 | 25601.00 |
| July 29, 2025 | 29177.00 |
| July 22, 2025 | 32866.00 |
| July 15, 2025 | 32187.00 |
| July 08, 2025 | 31916.00 |
| July 01, 2025 | 33096.00 |
| June 24, 2025 | 28488.00 |
| June 17, 2025 | 27813.00 |
News
Headline
Time (ET)
05/29 07:59
05/26 08:53
05/22 07:53
05/20 06:48
Basic Info
|
ICE US Dollar Index Combined Total Reportable Long Positions is at a current level of 39204.00, up from 37194.00 last week and up from 28049.00 one year ago. This is a change of 5.40% from last week and 39.77% from one year ago. |
| Report | Commitments of Traders |
| Category | Market Indices and Statistics |
| Region | N/A |
| Source | US Commodity Futures Trading Commission |
Stats
| Last Value | 39204.00 |
| Latest Period | May 26 2026 |
| Last Updated | May 29 2026, 15:36 EDT |
| Next Release | Jun 5 2026, 15:30 EDT |
| Average Growth Rate | 39.46% |
| Value from Last Week | 37194.00 |
| Change from Last Week | 5.40% |
| Value from 1 Year Ago | 28049.00 |
| Change from 1 Year Ago | 39.77% |
| Frequency | Weekly |
| Adjustment | N/A |
| Download Source File |