

Honeywell International Inc (HON) - Honeywell Building Technologies Revenue (DISCONTINUED) (I:HIIHONHB)
Level Chart
Basic Info
|
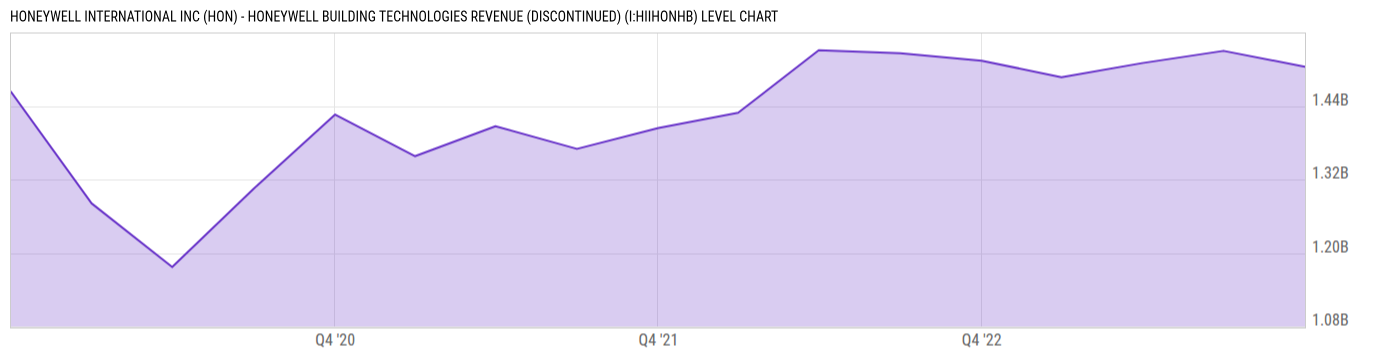
Honeywell International Inc (HON) - Honeywell Building Technologies Revenue is at a current level of 1.504B, down from 1.53B last quarter and down from 1.514B one year ago. This is a change of -1.70% from last quarter and -0.66% from one year ago. |
|
Honeywell International Inc Honeywell Building Technologies Revenue represents the total income generated by the company's building technologies business segment. |
| Report | Fiscal.ai |
| Category | Segments & KPIs |
| Region | United States |
| Source | Fiscal.ai |
|
Data provided via Fiscal.ai |
Stats
| Last Value | 1.504B |
| Latest Period | Dec 2023 |
| Last Updated | Feb 1 2024, 10:22 EST |
| Average Growth Rate | 1.37% |
| Value from Last Quarter | 1.53B |
| Change from Last Quarter | -1.70% |
| Value from 1 Year Ago | 1.514B |
| Change from 1 Year Ago | -0.66% |
| Frequency | Quarterly |
| Unit | USD |
| Adjustment | N/A |
| Download Source File |
Historical Data
| Date | Value |
|---|---|
| December 31, 2023 | 1.504B |
| September 30, 2023 | 1.53B |
| June 30, 2023 | 1.51B |
| March 31, 2023 | 1.487B |
| December 31, 2022 | 1.514B |
| September 30, 2022 | 1.526B |
| June 30, 2022 | 1.531B |
| March 31, 2022 | 1.429B |
| December 31, 2021 | 1.404B |
| Date | Value |
|---|---|
| September 30, 2021 | 1.37B |
| June 30, 2021 | 1.407B |
| March 31, 2021 | 1.358B |
| December 31, 2020 | 1.426B |
| September 30, 2020 | 1.305B |
| June 30, 2020 | 1.177B |
| March 31, 2020 | 1.281B |
| December 31, 2019 | 1.463B |
News
Basic Info
|
Honeywell International Inc (HON) - Honeywell Building Technologies Revenue is at a current level of 1.504B, down from 1.53B last quarter and down from 1.514B one year ago. This is a change of -1.70% from last quarter and -0.66% from one year ago. |
|
Honeywell International Inc Honeywell Building Technologies Revenue represents the total income generated by the company's building technologies business segment. |
| Report | Fiscal.ai |
| Category | Segments & KPIs |
| Region | United States |
| Source | Fiscal.ai |
|
Data provided via Fiscal.ai |
Stats
| Last Value | 1.504B |
| Latest Period | Dec 2023 |
| Last Updated | Feb 1 2024, 10:22 EST |
| Average Growth Rate | 1.37% |
| Value from Last Quarter | 1.53B |
| Change from Last Quarter | -1.70% |
| Value from 1 Year Ago | 1.514B |
| Change from 1 Year Ago | -0.66% |
| Frequency | Quarterly |
| Unit | USD |
| Adjustment | N/A |
| Download Source File |