

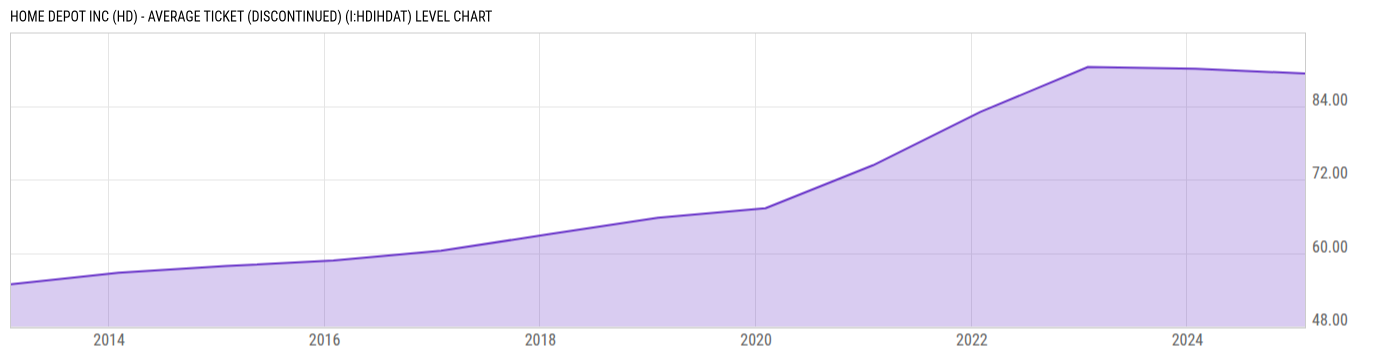
Home Depot Inc (HD) - Average Ticket (DISCONTINUED) (I:HDIHDAT)
89.31 USD for 2025
Level Chart
Basic Info
|
Home Depot Inc (HD) - Average Ticket is at a current level of 89.31, down from 90.07 one year ago. This is a change of -0.84% from one year ago. |
|
Average Ticket is a financial metric used by The Home Depot and other retailers to measure the average value of individual customer transactions within a specified period. |
| Report | Fiscal.ai |
| Category | Segments & KPIs |
| Region | United States |
| Source | Fiscal.ai |
|
Data provided via Fiscal.ai |
Stats
| Last Value | 89.31 |
| Latest Period | 2025 |
| Last Updated | Feb 15 2026, 08:32 EST |
| Average Growth Rate | 4.21% |
| Value from 1 Year Ago | 90.07 |
| Change from 1 Year Ago | -0.84% |
| Frequency | Yearly |
| Unit | USD |
| Adjustment | N/A |
| Download Source File |
Historical Data
| Date | Value |
|---|---|
| February 02, 2025 | 89.31 |
| January 28, 2024 | 90.07 |
| January 29, 2023 | 90.36 |
| January 30, 2022 | 83.04 |
| January 31, 2021 | 74.32 |
| February 02, 2020 | 67.30 |
| February 03, 2019 | 65.74 |
| Date | Value |
|---|---|
| January 28, 2018 | 63.06 |
| January 29, 2017 | 60.35 |
| January 31, 2016 | 58.77 |
| February 01, 2015 | 57.87 |
| February 02, 2014 | 56.78 |
| February 03, 2013 | 54.89 |
News
Headline
Time (ET)
07/23 08:00
07/14 10:40
Basic Info
|
Home Depot Inc (HD) - Average Ticket is at a current level of 89.31, down from 90.07 one year ago. This is a change of -0.84% from one year ago. |
|
Average Ticket is a financial metric used by The Home Depot and other retailers to measure the average value of individual customer transactions within a specified period. |
| Report | Fiscal.ai |
| Category | Segments & KPIs |
| Region | United States |
| Source | Fiscal.ai |
|
Data provided via Fiscal.ai |
Stats
| Last Value | 89.31 |
| Latest Period | 2025 |
| Last Updated | Feb 15 2026, 08:32 EST |
| Average Growth Rate | 4.21% |
| Value from 1 Year Ago | 90.07 |
| Change from 1 Year Ago | -0.84% |
| Frequency | Yearly |
| Unit | USD |
| Adjustment | N/A |
| Download Source File |