

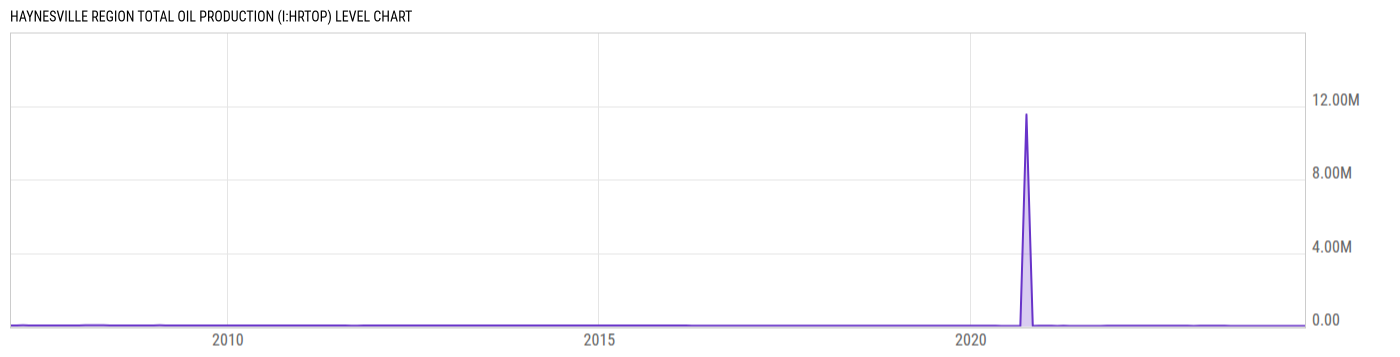
Haynesville Region Total Oil Production (I:HRTOP)
32222.20 bbl/d for Jun 2024
Level Chart
Basic Info
|
Haynesville Region Total Oil Production is at a current level of 32222.20, down from 32492.60 last month and up from 31393.30 one year ago. This is a change of -0.83% from last month and 2.64% from one year ago. |
| Report | Drilling Productivity Report |
| Category | Energy |
| Region | N/A |
| Source | Energy Information Administration |
Stats
| Last Value | 32222.20 |
| Latest Period | Jun 2024 |
| Last Updated | May 13 2024, 15:32 EDT |
| Next Release | Jun 9 2026, 15:30 EDT |
| Average Growth Rate | 2.00K% |
| Value from Last Month | 32492.60 |
| Change from Last Month | -0.83% |
| Value from 1 Year Ago | 31393.30 |
| Change from 1 Year Ago | 2.64% |
| Frequency | Monthly |
| Unit | Barrels per Day |
| Adjustment | N/A |
| Download Source File |
Historical Data
| Date | Value |
|---|---|
| June 30, 2024 | 32222.20 |
| May 31, 2024 | 32492.60 |
| April 30, 2024 | 32695.50 |
| March 31, 2024 | 32829.20 |
| February 29, 2024 | 32885.50 |
| January 31, 2024 | 32373.50 |
| December 31, 2023 | 33700.30 |
| November 30, 2023 | 32890.60 |
| October 31, 2023 | 32821.40 |
| September 30, 2023 | 31310.00 |
| August 31, 2023 | 32180.50 |
| July 31, 2023 | 32111.90 |
| June 30, 2023 | 31393.30 |
| May 31, 2023 | 34588.40 |
| April 30, 2023 | 34589.60 |
| March 31, 2023 | 35256.50 |
| February 28, 2023 | 35761.70 |
| January 31, 2023 | 35644.40 |
| December 31, 2022 | 33514.40 |
| November 30, 2022 | 35218.70 |
| October 31, 2022 | 35886.70 |
| September 30, 2022 | 36623.20 |
| August 31, 2022 | 35764.20 |
| July 31, 2022 | 34842.30 |
| June 30, 2022 | 35224.70 |
| Date | Value |
|---|---|
| May 31, 2022 | 36001.20 |
| April 30, 2022 | 37495.40 |
| March 31, 2022 | 38034.70 |
| February 28, 2022 | 36611.50 |
| January 31, 2022 | 36083.50 |
| December 31, 2021 | 36768.90 |
| November 30, 2021 | 36578.30 |
| October 31, 2021 | 35090.20 |
| September 30, 2021 | 33700.50 |
| August 31, 2021 | 32103.20 |
| July 31, 2021 | 32510.80 |
| June 30, 2021 | 32612.80 |
| May 31, 2021 | 32668.70 |
| April 30, 2021 | 33791.10 |
| March 31, 2021 | 34249.00 |
| February 28, 2021 | 28972.50 |
| January 31, 2021 | 34194.20 |
| December 31, 2020 | 34868.10 |
| November 30, 2020 | 34292.80 |
| October 31, 2020 | 33662.60 |
| September 30, 2020 | 11.54M |
| August 31, 2020 | 32962.50 |
| July 31, 2020 | 33601.29 |
| June 30, 2020 | 33976.23 |
| May 31, 2020 | 29673.52 |
News
Headline
Time (ET)
Basic Info
|
Haynesville Region Total Oil Production is at a current level of 32222.20, down from 32492.60 last month and up from 31393.30 one year ago. This is a change of -0.83% from last month and 2.64% from one year ago. |
| Report | Drilling Productivity Report |
| Category | Energy |
| Region | N/A |
| Source | Energy Information Administration |
Stats
| Last Value | 32222.20 |
| Latest Period | Jun 2024 |
| Last Updated | May 13 2024, 15:32 EDT |
| Next Release | Jun 9 2026, 15:30 EDT |
| Average Growth Rate | 2.00K% |
| Value from Last Month | 32492.60 |
| Change from Last Month | -0.83% |
| Value from 1 Year Ago | 31393.30 |
| Change from 1 Year Ago | 2.64% |
| Frequency | Monthly |
| Unit | Barrels per Day |
| Adjustment | N/A |
| Download Source File |