

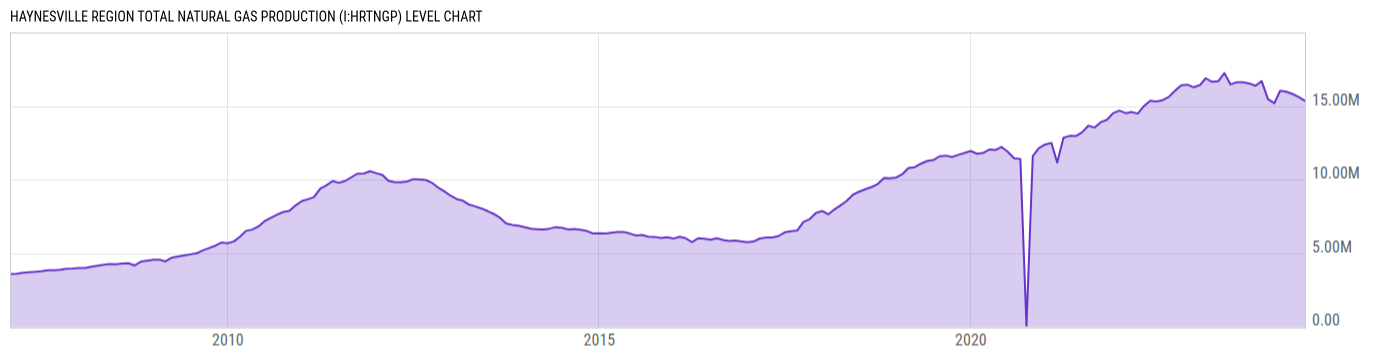
Haynesville Region Total Natural Gas Production (I:HRTNGP)
15.34M cf/d for Jun 2024
Level Chart
Basic Info
|
Haynesville Region Total Natural Gas Production is at a current level of 15.34M, down from 15.61M last month and down from 16.47M one year ago. This is a change of -1.71% from last month and -6.86% from one year ago. |
| Report | Drilling Productivity Report |
| Category | Energy |
| Region | N/A |
| Source | Energy Information Administration |
Stats
| Last Value | 15.34M |
| Latest Period | Jun 2024 |
| Last Updated | May 13 2024, 15:32 EDT |
| Next Release | Jun 9 2026, 15:30 EDT |
| Average Growth Rate | 1.98K% |
| Value from Last Month | 15.61M |
| Change from Last Month | -1.71% |
| Value from 1 Year Ago | 16.47M |
| Change from 1 Year Ago | -6.86% |
| Frequency | Monthly |
| Unit | Cubic Feet per Day |
| Adjustment | N/A |
| Download Source File |
Historical Data
| Date | Value |
|---|---|
| June 30, 2024 | 15.34M |
| May 31, 2024 | 15.61M |
| April 30, 2024 | 15.82M |
| March 31, 2024 | 15.97M |
| February 29, 2024 | 16.04M |
| January 31, 2024 | 15.19M |
| December 31, 2023 | 15.47M |
| November 30, 2023 | 16.69M |
| October 31, 2023 | 16.38M |
| September 30, 2023 | 16.54M |
| August 31, 2023 | 16.62M |
| July 31, 2023 | 16.61M |
| June 30, 2023 | 16.47M |
| May 31, 2023 | 17.24M |
| April 30, 2023 | 16.68M |
| March 31, 2023 | 16.64M |
| February 28, 2023 | 16.89M |
| January 31, 2023 | 16.42M |
| December 31, 2022 | 16.27M |
| November 30, 2022 | 16.45M |
| October 31, 2022 | 16.41M |
| September 30, 2022 | 16.04M |
| August 31, 2022 | 15.62M |
| July 31, 2022 | 15.40M |
| June 30, 2022 | 15.31M |
| Date | Value |
|---|---|
| May 31, 2022 | 15.36M |
| April 30, 2022 | 14.99M |
| March 31, 2022 | 14.48M |
| February 28, 2022 | 14.59M |
| January 31, 2022 | 14.51M |
| December 31, 2021 | 14.69M |
| November 30, 2021 | 14.52M |
| October 31, 2021 | 14.06M |
| September 30, 2021 | 13.90M |
| August 31, 2021 | 13.53M |
| July 31, 2021 | 13.65M |
| June 30, 2021 | 13.20M |
| May 31, 2021 | 12.95M |
| April 30, 2021 | 12.97M |
| March 31, 2021 | 12.83M |
| February 28, 2021 | 11.16M |
| January 31, 2021 | 12.48M |
| December 31, 2020 | 12.38M |
| November 30, 2020 | 12.14M |
| October 31, 2020 | 11.60M |
| September 30, 2020 | 33649.30 |
| August 31, 2020 | 11.40M |
| July 31, 2020 | 11.44M |
| June 30, 2020 | 11.88M |
| May 31, 2020 | 12.21M |
News
Headline
Time (ET)
Basic Info
|
Haynesville Region Total Natural Gas Production is at a current level of 15.34M, down from 15.61M last month and down from 16.47M one year ago. This is a change of -1.71% from last month and -6.86% from one year ago. |
| Report | Drilling Productivity Report |
| Category | Energy |
| Region | N/A |
| Source | Energy Information Administration |
Stats
| Last Value | 15.34M |
| Latest Period | Jun 2024 |
| Last Updated | May 13 2024, 15:32 EDT |
| Next Release | Jun 9 2026, 15:30 EDT |
| Average Growth Rate | 1.98K% |
| Value from Last Month | 15.61M |
| Change from Last Month | -1.71% |
| Value from 1 Year Ago | 16.47M |
| Change from 1 Year Ago | -6.86% |
| Frequency | Monthly |
| Unit | Cubic Feet per Day |
| Adjustment | N/A |
| Download Source File |