

Haynesville Region Active Rigs (I:HRAR)
Level Chart
Basic Info
|
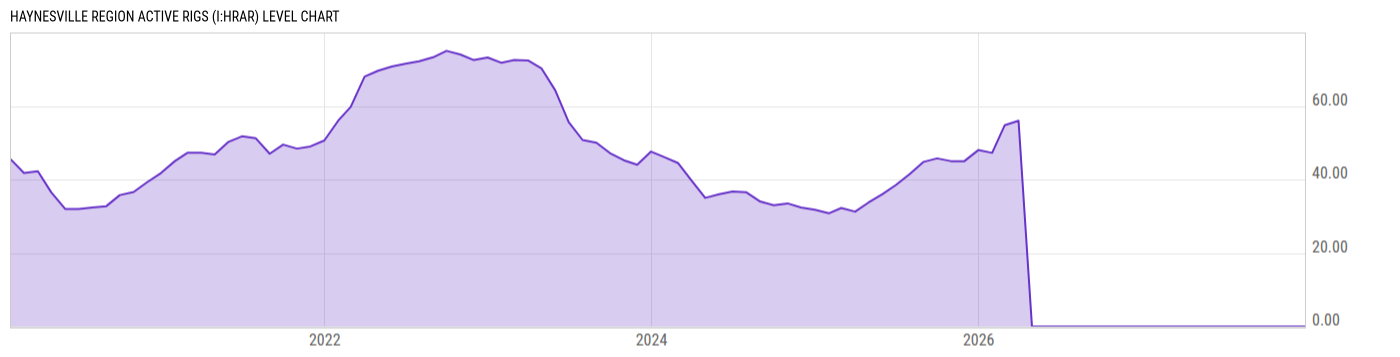
Haynesville Region Active Rigs is at a current level of 0.000, unchanged from 0.000 last month. This is a change of N/A from last month. |
| Report | Short-Term Energy Outlook |
| Category | Energy |
| Region | United States |
| Source | Energy Information Administration |
Stats
| Last Value | 0.00 |
| Latest Period | Dec 2027 |
| Last Updated | Apr 7 2026, 12:03 EDT |
| Next Release | Jun 9 2026, 10:00 EDT |
| Average Growth Rate | -10.48% |
| Value from Last Month | 0.00 |
| Change from Last Month | N/A |
| Value from 1 Year Ago | 0.00 |
| Change from 1 Year Ago | N/A |
| Frequency | Monthly |
| Adjustment | N/A |
| Download Source File |
Historical Data
| Date | Value |
|---|---|
| December 31, 2027 | 0.00 |
| November 30, 2027 | 0.00 |
| October 31, 2027 | 0.00 |
| September 30, 2027 | 0.00 |
| August 31, 2027 | 0.00 |
| July 31, 2027 | 0.00 |
| June 30, 2027 | 0.00 |
| May 31, 2027 | 0.00 |
| April 30, 2027 | 0.00 |
| March 31, 2027 | 0.00 |
| February 28, 2027 | 0.00 |
| January 31, 2027 | 0.00 |
| December 31, 2026 | 0.00 |
| November 30, 2026 | 0.00 |
| October 31, 2026 | 0.00 |
| September 30, 2026 | 0.00 |
| August 31, 2026 | 0.00 |
| July 31, 2026 | 0.00 |
| June 30, 2026 | 0.00 |
| May 31, 2026 | 0.00 |
| April 30, 2026 | 0.00 |
| March 31, 2026 | 56.00 |
| February 28, 2026 | 54.75 |
| January 31, 2026 | 47.25 |
| December 31, 2025 | 48.00 |
| Date | Value |
|---|---|
| November 30, 2025 | 45.00 |
| October 31, 2025 | 45.00 |
| September 30, 2025 | 45.75 |
| August 31, 2025 | 44.80 |
| July 31, 2025 | 41.50 |
| June 30, 2025 | 38.50 |
| May 31, 2025 | 36.00 |
| April 30, 2025 | 33.75 |
| March 31, 2025 | 31.25 |
| February 28, 2025 | 32.25 |
| January 31, 2025 | 30.80 |
| December 31, 2024 | 31.75 |
| November 30, 2024 | 32.40 |
| October 31, 2024 | 33.50 |
| September 30, 2024 | 33.00 |
| August 31, 2024 | 34.00 |
| July 31, 2024 | 36.50 |
| June 30, 2024 | 36.75 |
| May 31, 2024 | 36.00 |
| April 30, 2024 | 35.00 |
| March 31, 2024 | 39.60 |
| February 29, 2024 | 44.50 |
| January 31, 2024 | 46.00 |
| December 31, 2023 | 47.60 |
| November 30, 2023 | 44.00 |
News
Headline
Time (ET)
05/12 15:59
04/30 15:51
Basic Info
|
Haynesville Region Active Rigs is at a current level of 0.000, unchanged from 0.000 last month. This is a change of N/A from last month. |
| Report | Short-Term Energy Outlook |
| Category | Energy |
| Region | United States |
| Source | Energy Information Administration |
Stats
| Last Value | 0.00 |
| Latest Period | Dec 2027 |
| Last Updated | Apr 7 2026, 12:03 EDT |
| Next Release | Jun 9 2026, 10:00 EDT |
| Average Growth Rate | -10.48% |
| Value from Last Month | 0.00 |
| Change from Last Month | N/A |
| Value from 1 Year Ago | 0.00 |
| Change from 1 Year Ago | N/A |
| Frequency | Monthly |
| Adjustment | N/A |
| Download Source File |