

Gulf of Mexico Federal Offshore Crude Oil Production (I:GMFOCOP)
61.24M bbl for Mar 2026
Level Chart
Basic Info
|
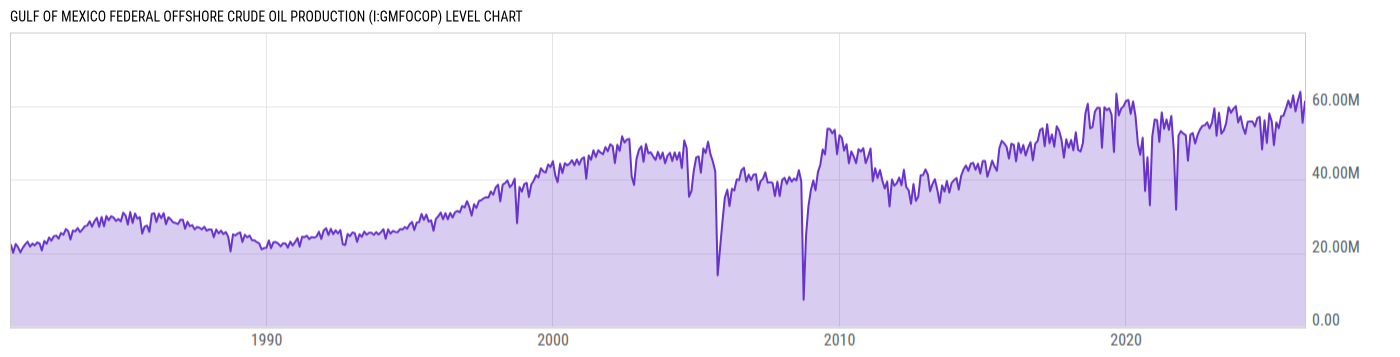
Gulf of Mexico Federal Offshore Crude Oil Production is at a current level of 61.24M, up from 55.43M last month and up from 55.53M one year ago. This is a change of 10.48% from last month and 10.29% from one year ago. |
| Report | Crude Oil Production |
| Category | Energy |
| Region | Mexico |
| Source | Energy Information Administration |
Stats
| Last Value | 61.24M |
| Latest Period | Mar 2026 |
| Last Updated | May 29 2026, 15:32 EDT |
| Next Release | Jun 30 2026, 15:30 EDT |
| Average Growth Rate | 12.62% |
| Value from Last Month | 55.43M |
| Change from Last Month | 10.48% |
| Value from 1 Year Ago | 55.53M |
| Change from 1 Year Ago | 10.29% |
| Frequency | Monthly |
| Unit | Barrels |
| Adjustment | N/A |
| Download Source File |
Historical Data
| Date | Value |
|---|---|
| March 31, 2026 | 61.24M |
| February 28, 2026 | 55.43M |
| January 31, 2026 | 63.85M |
| December 31, 2025 | 61.55M |
| November 30, 2025 | 58.55M |
| October 31, 2025 | 62.89M |
| September 30, 2025 | 59.57M |
| August 31, 2025 | 61.47M |
| July 31, 2025 | 59.34M |
| June 30, 2025 | 57.37M |
| May 31, 2025 | 57.20M |
| April 30, 2025 | 53.96M |
| March 31, 2025 | 55.53M |
| February 28, 2025 | 49.37M |
| January 31, 2025 | 55.84M |
| December 31, 2024 | 57.96M |
| November 30, 2024 | 49.94M |
| October 31, 2024 | 56.12M |
| September 30, 2024 | 48.21M |
| August 31, 2024 | 57.03M |
| July 31, 2024 | 56.68M |
| June 30, 2024 | 54.45M |
| May 31, 2024 | 55.76M |
| April 30, 2024 | 55.76M |
| March 31, 2024 | 55.75M |
| Date | Value |
|---|---|
| February 29, 2024 | 52.44M |
| January 31, 2024 | 54.13M |
| December 31, 2023 | 57.22M |
| November 30, 2023 | 55.53M |
| October 31, 2023 | 59.97M |
| September 30, 2023 | 59.22M |
| August 31, 2023 | 58.16M |
| July 31, 2023 | 59.69M |
| June 30, 2023 | 55.34M |
| May 31, 2023 | 53.34M |
| April 30, 2023 | 52.49M |
| March 31, 2023 | 58.18M |
| February 28, 2023 | 51.90M |
| January 31, 2023 | 59.35M |
| December 31, 2022 | 55.44M |
| November 30, 2022 | 53.91M |
| October 31, 2022 | 55.58M |
| September 30, 2022 | 54.74M |
| August 31, 2022 | 54.60M |
| July 31, 2022 | 53.56M |
| June 30, 2022 | 52.05M |
| May 31, 2022 | 49.80M |
| April 30, 2022 | 52.63M |
| March 31, 2022 | 52.23M |
| February 28, 2022 | 45.16M |
News
Headline
Time (ET)
05/28 08:34
05/27 06:13
05/13 14:39
05/06 06:06
Basic Info
|
Gulf of Mexico Federal Offshore Crude Oil Production is at a current level of 61.24M, up from 55.43M last month and up from 55.53M one year ago. This is a change of 10.48% from last month and 10.29% from one year ago. |
| Report | Crude Oil Production |
| Category | Energy |
| Region | Mexico |
| Source | Energy Information Administration |
Stats
| Last Value | 61.24M |
| Latest Period | Mar 2026 |
| Last Updated | May 29 2026, 15:32 EDT |
| Next Release | Jun 30 2026, 15:30 EDT |
| Average Growth Rate | 12.62% |
| Value from Last Month | 55.43M |
| Change from Last Month | 10.48% |
| Value from 1 Year Ago | 55.53M |
| Change from 1 Year Ago | 10.29% |
| Frequency | Monthly |
| Unit | Barrels |
| Adjustment | N/A |
| Download Source File |