

Goldman Sachs Group Inc (GS) - Platform Solutions Assets (I:GSGILA4G)
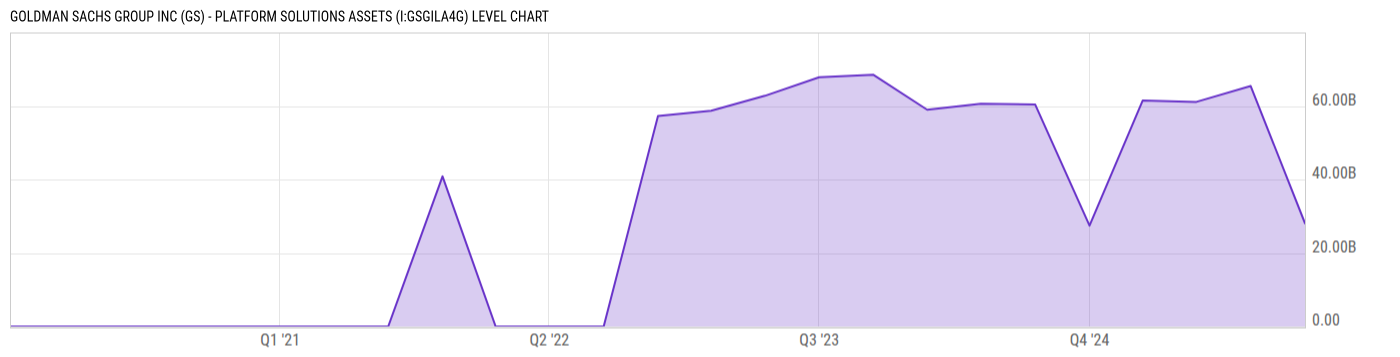
28.08B USD for Q4 2025
Level Chart
Basic Info
|
Goldman Sachs Group Inc (GS) - Platform Solutions Assets is at a current level of 28.08B, down from 65.43B last quarter and up from 27.45B one year ago. This is a change of -57.08% from last quarter and 2.28% from one year ago. |
| Report | Fiscal.ai |
| Category | Segments & KPIs |
| Region | United States |
| Source | Fiscal.ai |
|
Data provided via Fiscal.ai |
Stats
| Last Value | 28.08B |
| Latest Period | Dec 2025 |
| Last Updated | Mar 23 2026, 14:10 EDT |
| Next Release | Apr 15 2026, 08:30 EDT (E) |
| Average Growth Rate | -22.87% |
| Value from Last Quarter | 65.43B |
| Change from Last Quarter | -57.08% |
| Value from 1 Year Ago | 27.45B |
| Change from 1 Year Ago | 2.28% |
| Frequency | Quarterly |
| Unit | USD |
| Adjustment | N/A |
| Download Source File |
Historical Data
| Date | Value |
|---|---|
| December 31, 2025 | 28.08B |
| September 30, 2025 | 65.43B |
| June 30, 2025 | 61.12B |
| March 31, 2025 | 61.46B |
| December 31, 2024 | 27.45B |
| September 30, 2024 | 60.38B |
| June 30, 2024 | 60.63B |
| March 31, 2024 | 58.97B |
| December 31, 2023 | 68.48B |
| September 30, 2023 | 67.84B |
| June 30, 2023 | 62.77B |
| March 31, 2023 | 58.70B |
| December 31, 2022 | 57.29B |
| Date | Value |
|---|---|
| September 30, 2022 | 0.00 |
| June 30, 2022 | 0.00 |
| March 31, 2022 | 0.00 |
| December 31, 2021 | 40.84B |
| September 30, 2021 | 0.00 |
| June 30, 2021 | 0.00 |
| March 31, 2021 | 0.00 |
| December 31, 2020 | 0.00 |
| September 30, 2020 | 0.00 |
| June 30, 2020 | 0.00 |
| March 31, 2020 | 0.00 |
| December 31, 2019 | 0.00 |
News
Headline
Time (ET)
05/11 16:10
05/08 08:40
Basic Info
|
Goldman Sachs Group Inc (GS) - Platform Solutions Assets is at a current level of 28.08B, down from 65.43B last quarter and up from 27.45B one year ago. This is a change of -57.08% from last quarter and 2.28% from one year ago. |
| Report | Fiscal.ai |
| Category | Segments & KPIs |
| Region | United States |
| Source | Fiscal.ai |
|
Data provided via Fiscal.ai |
Stats
| Last Value | 28.08B |
| Latest Period | Dec 2025 |
| Last Updated | Mar 23 2026, 14:10 EDT |
| Next Release | Apr 15 2026, 08:30 EDT (E) |
| Average Growth Rate | -22.87% |
| Value from Last Quarter | 65.43B |
| Change from Last Quarter | -57.08% |
| Value from 1 Year Ago | 27.45B |
| Change from 1 Year Ago | 2.28% |
| Frequency | Quarterly |
| Unit | USD |
| Adjustment | N/A |
| Download Source File |