

Gold Price in South African Rand (I:GPSARNM)
78056.71 ZAR/oz t for Apr 2026
Level Chart
Basic Info
|
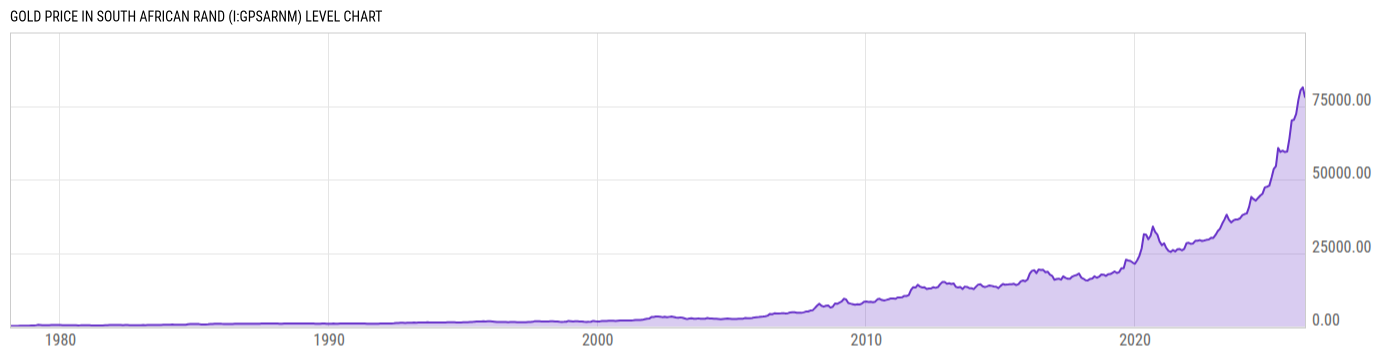
Gold Price in South African Rand is at a current level of 78056.71, down from 81387.25 last month and up from 60732.41 one year ago. This is a change of -4.09% from last month and 28.53% from one year ago. |
| Report | Gold Prices |
| Category | Metals |
| Region | South Africa |
| Source | Gold Council |
Stats
| Last Value | 78056.71 |
| Latest Period | Apr 2026 |
| Last Updated | May 6 2026, 12:08 EDT |
| Next Release | Jun 3 2026, 08:30 EDT |
| Average Growth Rate | 13.98% |
| Value from Last Month | 81387.25 |
| Change from Last Month | -4.09% |
| Value from 1 Year Ago | 60732.41 |
| Change from 1 Year Ago | 28.53% |
| Frequency | Monthly |
| Unit | ZAR per Troy Ounce |
| Adjustment | N/A |
| Download Source File | |
| Notes | London PM fix daily gold prices. |
Historical Data
| Date | Value |
|---|---|
| April 30, 2026 | 78056.71 |
| March 31, 2026 | 81387.25 |
| February 28, 2026 | 80314.58 |
| January 31, 2026 | 77172.34 |
| December 31, 2025 | 72334.27 |
| November 30, 2025 | 70313.62 |
| October 31, 2025 | 70049.95 |
| September 30, 2025 | 63905.35 |
| August 31, 2025 | 59538.08 |
| July 31, 2025 | 59338.94 |
| June 30, 2025 | 59783.13 |
| May 31, 2025 | 59369.58 |
| April 30, 2025 | 60732.41 |
| March 31, 2025 | 54529.38 |
| February 28, 2025 | 53496.21 |
| January 31, 2025 | 50689.77 |
| December 31, 2024 | 47910.30 |
| November 30, 2024 | 47541.60 |
| October 31, 2024 | 47314.00 |
| September 30, 2024 | 45188.84 |
| August 31, 2024 | 44565.29 |
| July 31, 2024 | 43716.51 |
| June 30, 2024 | 42806.98 |
| May 31, 2024 | 43302.10 |
| April 30, 2024 | 44091.10 |
| Date | Value |
|---|---|
| March 31, 2024 | 40686.19 |
| February 29, 2024 | 38484.92 |
| January 31, 2024 | 38254.80 |
| December 31, 2023 | 37872.00 |
| November 30, 2023 | 36820.90 |
| October 31, 2023 | 36414.40 |
| September 30, 2023 | 36380.60 |
| August 31, 2023 | 36075.80 |
| July 31, 2023 | 35396.50 |
| June 30, 2023 | 36376.00 |
| May 31, 2023 | 38025.10 |
| April 30, 2023 | 36357.50 |
| March 31, 2023 | 34928.60 |
| February 28, 2023 | 33207.80 |
| January 31, 2023 | 32473.60 |
| December 31, 2022 | 31136.60 |
| November 30, 2022 | 30111.40 |
| October 31, 2022 | 30155.10 |
| September 30, 2022 | 29599.30 |
| August 31, 2022 | 29471.80 |
| July 31, 2022 | 29255.40 |
| June 30, 2022 | 29086.50 |
| May 31, 2022 | 29378.80 |
| April 30, 2022 | 29156.10 |
| March 31, 2022 | 29147.90 |
News
Headline
Time (ET)
05/22 14:00
05/12 14:00
04/28 14:00
Basic Info
|
Gold Price in South African Rand is at a current level of 78056.71, down from 81387.25 last month and up from 60732.41 one year ago. This is a change of -4.09% from last month and 28.53% from one year ago. |
| Report | Gold Prices |
| Category | Metals |
| Region | South Africa |
| Source | Gold Council |
Stats
| Last Value | 78056.71 |
| Latest Period | Apr 2026 |
| Last Updated | May 6 2026, 12:08 EDT |
| Next Release | Jun 3 2026, 08:30 EDT |
| Average Growth Rate | 13.98% |
| Value from Last Month | 81387.25 |
| Change from Last Month | -4.09% |
| Value from 1 Year Ago | 60732.41 |
| Change from 1 Year Ago | 28.53% |
| Frequency | Monthly |
| Unit | ZAR per Troy Ounce |
| Adjustment | N/A |
| Download Source File | |
| Notes | London PM fix daily gold prices. |