

Germany Trade and Industry: Finished Products Imports (I:GTIFPI)
79.93B EUR for Feb 2026
Level Chart
Basic Info
|
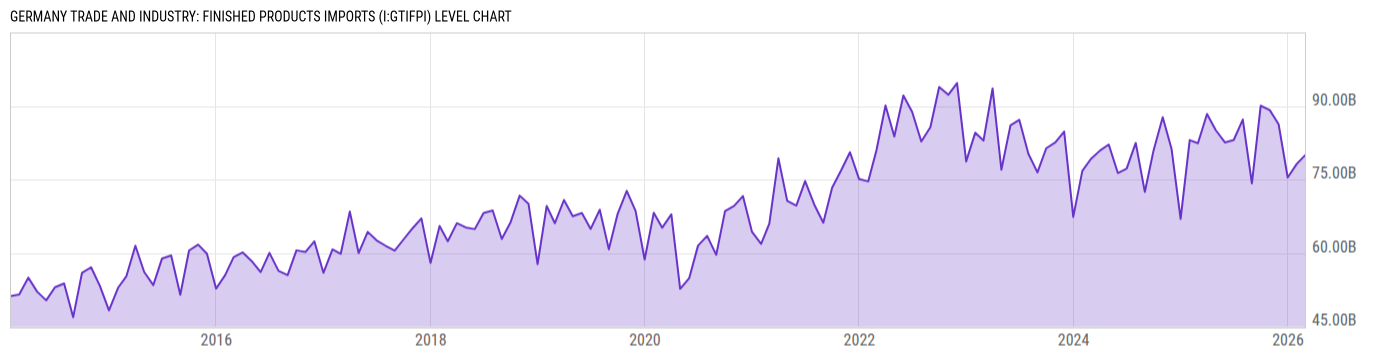
Germany Trade and Industry: Finished Products Imports is at a current level of 79.93B, up from 78.19B last month and down from 82.40B one year ago. This is a change of 2.23% from last month and -3.00% from one year ago. |
| Report | Germany Foreign Trade |
| Category | International Transactions |
| Region | Germany |
| Source | Federal Statistical Office of Germany |
Stats
| Last Value | 79.93B |
| Latest Period | Feb 2026 |
| Last Updated | May 8 2026, 02:02 EDT |
| Next Release | Jun 9 2026, 02:00 EDT |
| Average Growth Rate | 8.55% |
| Value from Last Month | 78.19B |
| Change from Last Month | 2.23% |
| Value from 1 Year Ago | 82.40B |
| Change from 1 Year Ago | -3.00% |
| Frequency | Monthly |
| Unit | EUR |
| Adjustment | Not Seasonally Adjusted |
| Download Source File |
Historical Data
| Date | Value |
|---|---|
| February 28, 2026 | 79.93B |
| January 31, 2026 | 78.19B |
| December 31, 2025 | 75.41B |
| November 30, 2025 | 86.28B |
| October 31, 2025 | 89.15B |
| September 30, 2025 | 90.05B |
| August 31, 2025 | 74.21B |
| July 31, 2025 | 87.24B |
| June 30, 2025 | 83.06B |
| May 31, 2025 | 82.56B |
| April 30, 2025 | 85.06B |
| March 31, 2025 | 88.37B |
| February 28, 2025 | 82.40B |
| January 31, 2025 | 83.04B |
| December 31, 2024 | 66.96B |
| November 30, 2024 | 81.28B |
| October 31, 2024 | 87.72B |
| September 30, 2024 | 80.99B |
| August 31, 2024 | 72.46B |
| July 31, 2024 | 82.47B |
| June 30, 2024 | 77.22B |
| May 31, 2024 | 76.31B |
| April 30, 2024 | 82.14B |
| March 31, 2024 | 80.89B |
| February 29, 2024 | 79.18B |
| Date | Value |
|---|---|
| January 31, 2024 | 76.76B |
| December 31, 2023 | 67.36B |
| November 30, 2023 | 84.78B |
| October 31, 2023 | 82.59B |
| September 30, 2023 | 81.38B |
| August 31, 2023 | 76.45B |
| July 31, 2023 | 80.26B |
| June 30, 2023 | 87.18B |
| May 31, 2023 | 86.04B |
| April 30, 2023 | 76.99B |
| March 31, 2023 | 93.58B |
| February 28, 2023 | 82.94B |
| January 31, 2023 | 84.56B |
| December 31, 2022 | 78.70B |
| November 30, 2022 | 94.68B |
| October 31, 2022 | 92.28B |
| September 30, 2022 | 93.88B |
| August 31, 2022 | 85.67B |
| July 31, 2022 | 82.75B |
| June 30, 2022 | 88.79B |
| May 31, 2022 | 92.16B |
| April 30, 2022 | 83.78B |
| March 31, 2022 | 90.10B |
| February 28, 2022 | 80.93B |
| January 31, 2022 | 74.61B |
News
Headline
Time (ET)
06/03 05:58
05/27 07:40
05/22 07:43
05/13 07:39
Basic Info
|
Germany Trade and Industry: Finished Products Imports is at a current level of 79.93B, up from 78.19B last month and down from 82.40B one year ago. This is a change of 2.23% from last month and -3.00% from one year ago. |
| Report | Germany Foreign Trade |
| Category | International Transactions |
| Region | Germany |
| Source | Federal Statistical Office of Germany |
Stats
| Last Value | 79.93B |
| Latest Period | Feb 2026 |
| Last Updated | May 8 2026, 02:02 EDT |
| Next Release | Jun 9 2026, 02:00 EDT |
| Average Growth Rate | 8.55% |
| Value from Last Month | 78.19B |
| Change from Last Month | 2.23% |
| Value from 1 Year Ago | 82.40B |
| Change from 1 Year Ago | -3.00% |
| Frequency | Monthly |
| Unit | EUR |
| Adjustment | Not Seasonally Adjusted |
| Download Source File |