

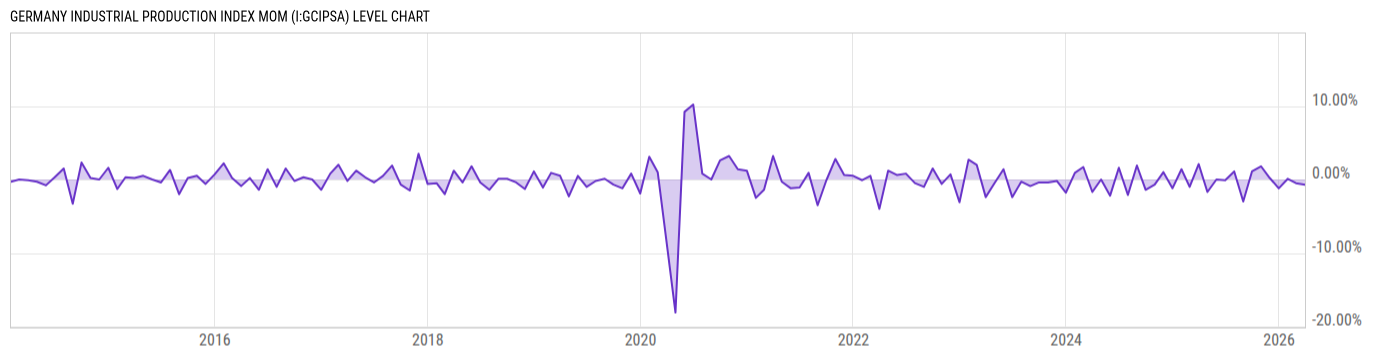
Germany Industrial Production Index MoM (I:GCIPSA)
0.40% for Apr 2026
Level Chart
Basic Info
|
Germany Industrial Production Index MoM is at 0.40%, compared to -0.10% last month and -2.50% last year. This is higher than the long term average of -0.03%. |
| Report | Germany Industrial Production |
| Category | Manufacturing Business Statistics |
| Region | Germany |
| Source | Federal Statistical Office of Germany |
Stats
| Last Value | 0.40% |
| Latest Period | Apr 2026 |
| Last Updated | Jun 9 2026, 02:06 EDT |
| Next Release | Jul 7 2026, 02:00 EDT |
| Long Term Average | -0.03% |
| Average Growth Rate | -1.84K% |
| Value from Last Month | -0.10% |
| Change from Last Month | N/A |
| Value from 1 Year Ago | -2.50% |
| Change from 1 Year Ago | N/A |
| Frequency | Monthly |
| Unit | Percent |
| Adjustment | Seasonally and Calendar Adjusted |
| Download Source File |
Historical Data
| Date | Value |
|---|---|
| April 30, 2026 | 0.40% |
| March 31, 2026 | -0.10% |
| February 28, 2026 | -0.20% |
| January 31, 2026 | -0.30% |
| December 31, 2025 | -0.50% |
| November 30, 2025 | 0.80% |
| October 31, 2025 | 0.40% |
| September 30, 2025 | 0.80% |
| August 31, 2025 | -2.00% |
| July 31, 2025 | 0.10% |
| June 30, 2025 | 0.00% |
| May 31, 2025 | 0.10% |
| April 30, 2025 | -2.50% |
| March 31, 2025 | 2.60% |
| February 28, 2025 | -1.30% |
| January 31, 2025 | 2.40% |
| December 31, 2024 | -1.40% |
| November 30, 2024 | 1.10% |
| October 31, 2024 | -0.50% |
| September 30, 2024 | -1.60% |
| August 31, 2024 | 1.90% |
| July 31, 2024 | -2.10% |
| June 30, 2024 | 2.30% |
| May 31, 2024 | -2.80% |
| April 30, 2024 | -0.10% |
| Date | Value |
|---|---|
| March 31, 2024 | -1.70% |
| February 29, 2024 | 1.70% |
| January 31, 2024 | 0.90% |
| December 31, 2023 | -1.80% |
| November 30, 2023 | -0.20% |
| October 31, 2023 | -0.40% |
| September 30, 2023 | -0.40% |
| August 31, 2023 | -0.90% |
| July 31, 2023 | -0.30% |
| June 30, 2023 | -2.40% |
| May 31, 2023 | 1.40% |
| April 30, 2023 | -0.50% |
| March 31, 2023 | -2.40% |
| February 28, 2023 | 2.00% |
| January 31, 2023 | 2.70% |
| December 31, 2022 | -3.10% |
| November 30, 2022 | 0.70% |
| October 31, 2022 | -0.60% |
| September 30, 2022 | 1.50% |
| August 31, 2022 | -1.00% |
| July 31, 2022 | -0.50% |
| June 30, 2022 | 0.80% |
| May 31, 2022 | 0.60% |
| April 30, 2022 | 1.20% |
| March 31, 2022 | -4.00% |
News
Headline
Time (ET)
06/01 11:11
05/22 07:43
05/13 07:39
Basic Info
|
Germany Industrial Production Index MoM is at 0.40%, compared to -0.10% last month and -2.50% last year. This is higher than the long term average of -0.03%. |
| Report | Germany Industrial Production |
| Category | Manufacturing Business Statistics |
| Region | Germany |
| Source | Federal Statistical Office of Germany |
Stats
| Last Value | 0.40% |
| Latest Period | Apr 2026 |
| Last Updated | Jun 9 2026, 02:06 EDT |
| Next Release | Jul 7 2026, 02:00 EDT |
| Long Term Average | -0.03% |
| Average Growth Rate | -1.84K% |
| Value from Last Month | -0.10% |
| Change from Last Month | N/A |
| Value from 1 Year Ago | -2.50% |
| Change from 1 Year Ago | N/A |
| Frequency | Monthly |
| Unit | Percent |
| Adjustment | Seasonally and Calendar Adjusted |
| Download Source File |
Related Indicators
| Germany Economy |
| Germany Producer Price Index MoM | 1.20% |
| Germany Producer Price Index YoY | 1.70% |
| Germany Real GDP QoQ | 0.30% |
| Germany Real GDP YoY | 0.50% |
| Germany Real GDP YoY | 0.40% |
| Germany Real Retail Sales MoM | -0.30% |
| Germany Real Retail Sales YoY | 2.10% |
| Germany Trade Balance | 14.50B EUR |
| Germany Unemployment Rate | 6.30% |
| ZEW Indicator of Economic Sentiment for Germany | -10.20 |