

Flexible CPI 12-Month (I:FCPI12M)
6.99% for May 2026
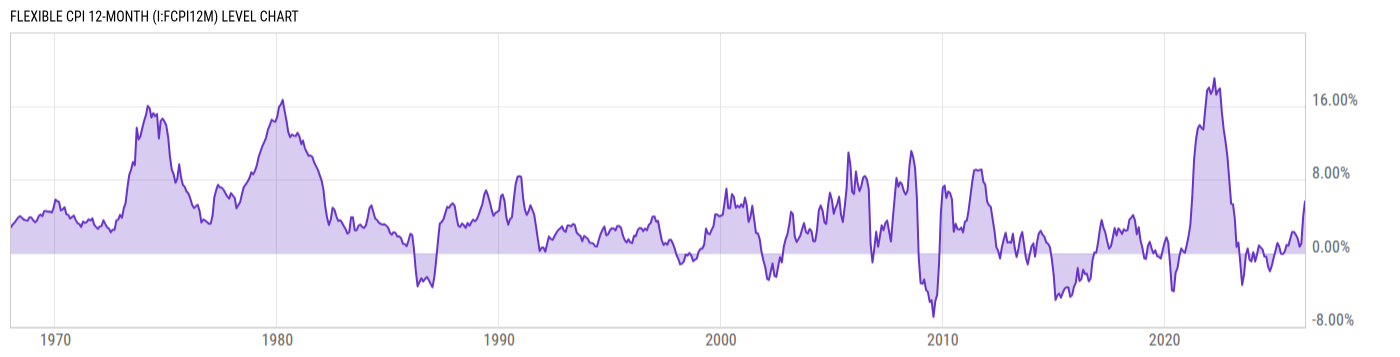
Level Chart
Basic Info
|
Flexible CPI 12-Month is at 6.99%, compared to 5.62% last month and 0.14% last year. This is higher than the long term average of 3.86%. |
| Report | Sticky Price Consumer Price Index |
| Category | Consumer Prices |
| Region | United States |
| Source | Federal Reserve Bank of Atlanta |
Stats
| Last Value | 6.99% |
| Latest Period | May 2026 |
| Last Updated | Jun 10 2026, 11:01 EDT |
| Next Release | Jul 14 2026, 11:00 EDT |
| Long Term Average | 3.86% |
| Average Growth Rate | 31.83% |
| Value from Last Month | 5.62% |
| Change from Last Month | 24.49% |
| Value from 1 Year Ago | 0.14% |
| Change from 1 Year Ago | 4.79K% |
| Frequency | Monthly |
| Unit | Percent |
| Adjustment | Seasonally Adjusted |
| Download Source File |
Historical Data
| Date | Value |
|---|---|
| May 31, 2026 | 6.99% |
| April 30, 2026 | 5.62% |
| March 31, 2026 | 3.99% |
| February 28, 2026 | 0.99% |
| January 31, 2026 | 0.67% |
| December 31, 2025 | 1.56% |
| November 30, 2025 | 1.99% |
| October 31, 2025 | 2.30% |
| September 30, 2025 | 2.28% |
| August 31, 2025 | 1.57% |
| July 31, 2025 | 0.80% |
| June 30, 2025 | 0.88% |
| May 31, 2025 | 0.14% |
| April 30, 2025 | -0.12% |
| March 31, 2025 | -0.09% |
| February 28, 2025 | 0.74% |
| January 31, 2025 | 1.09% |
| December 31, 2024 | 0.27% |
| November 30, 2024 | -0.52% |
| October 31, 2024 | -1.38% |
| September 30, 2024 | -1.99% |
| August 31, 2024 | -1.50% |
| July 31, 2024 | -0.41% |
| June 30, 2024 | -0.39% |
| May 31, 2024 | 0.40% |
| Date | Value |
|---|---|
| April 30, 2024 | 0.61% |
| March 31, 2024 | 0.82% |
| February 29, 2024 | -0.19% |
| January 31, 2024 | -0.92% |
| December 31, 2023 | 0.10% |
| November 30, 2023 | -0.91% |
| October 31, 2023 | -0.76% |
| September 30, 2023 | 0.48% |
| August 31, 2023 | -0.17% |
| July 31, 2023 | -2.34% |
| June 30, 2023 | -3.49% |
| May 31, 2023 | -1.09% |
| April 30, 2023 | 1.13% |
| March 31, 2023 | 0.66% |
| February 28, 2023 | 3.82% |
| January 31, 2023 | 5.30% |
| December 31, 2022 | 5.35% |
| November 30, 2022 | 8.02% |
| October 31, 2022 | 10.46% |
| September 30, 2022 | 12.11% |
| August 31, 2022 | 13.42% |
| July 31, 2022 | 15.33% |
| June 30, 2022 | 17.91% |
| May 31, 2022 | 17.67% |
| April 30, 2022 | 17.23% |
News
Headline
Time (ET)
05/22 07:41
05/14 06:14
Basic Info
|
Flexible CPI 12-Month is at 6.99%, compared to 5.62% last month and 0.14% last year. This is higher than the long term average of 3.86%. |
| Report | Sticky Price Consumer Price Index |
| Category | Consumer Prices |
| Region | United States |
| Source | Federal Reserve Bank of Atlanta |
Stats
| Last Value | 6.99% |
| Latest Period | May 2026 |
| Last Updated | Jun 10 2026, 11:01 EDT |
| Next Release | Jul 14 2026, 11:00 EDT |
| Long Term Average | 3.86% |
| Average Growth Rate | 31.83% |
| Value from Last Month | 5.62% |
| Change from Last Month | 24.49% |
| Value from 1 Year Ago | 0.14% |
| Change from 1 Year Ago | 4.79K% |
| Frequency | Monthly |
| Unit | Percent |
| Adjustment | Seasonally Adjusted |
| Download Source File |