

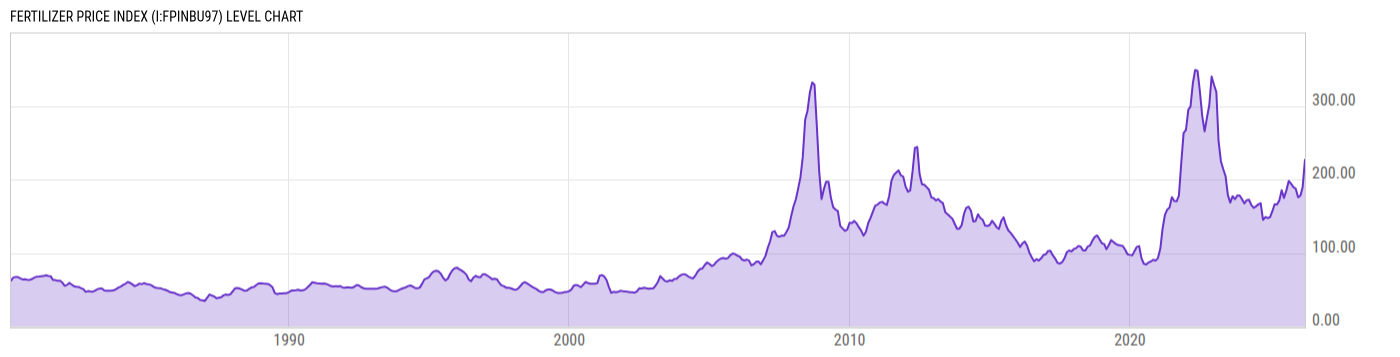
Fertilizer Price Index (I:FPINBU97)
226.99 for Mar 2026
Level Chart
Basic Info
|
Fertilizer Price Index is at a current level of 226.99, up from 189.38 last month and up from 166.09 one year ago. This is a change of 19.86% from last month and 36.67% from one year ago. |
| Report | IMF Primary Commodity Prices |
| Categories | Agriculture and Livestock , Chemicals , Metals |
| Region | N/A |
| Source | International Monetary Fund |
Stats
| Last Value | 226.99 |
| Latest Period | Mar 2026 |
| Last Updated | May 6 2026, 11:11 EDT |
| Next Release | Jun 3 2026, 08:00 EDT (E) |
| Average Growth Rate | 4.56% |
| Value from Last Month | 189.38 |
| Change from Last Month | 19.86% |
| Value from 1 Year Ago | 166.09 |
| Change from 1 Year Ago | 36.67% |
| Frequency | Monthly |
| Unit | Index 2016=100 |
| Adjustment | N/A |
| Download Source File | |
| Notes | Fertilizer Index, includes DAP, Potash, UREA |
Historical Data
| Date | Value |
|---|---|
| March 31, 2026 | 226.99 |
| February 28, 2026 | 189.38 |
| January 31, 2026 | 178.15 |
| December 31, 2025 | 175.73 |
| November 30, 2025 | 187.55 |
| October 31, 2025 | 189.59 |
| September 30, 2025 | 194.34 |
| August 31, 2025 | 197.97 |
| July 31, 2025 | 184.89 |
| June 30, 2025 | 175.03 |
| May 31, 2025 | 185.48 |
| April 30, 2025 | 171.24 |
| March 31, 2025 | 166.09 |
| February 28, 2025 | 166.28 |
| January 31, 2025 | 157.18 |
| December 31, 2024 | 148.69 |
| November 30, 2024 | 147.53 |
| October 31, 2024 | 148.95 |
| September 30, 2024 | 145.11 |
| August 31, 2024 | 167.67 |
| July 31, 2024 | 166.15 |
| June 30, 2024 | 163.45 |
| May 31, 2024 | 161.51 |
| April 30, 2024 | 165.35 |
| March 31, 2024 | 172.42 |
| Date | Value |
|---|---|
| February 29, 2024 | 171.73 |
| January 31, 2024 | 167.54 |
| December 31, 2023 | 173.24 |
| November 30, 2023 | 178.23 |
| October 31, 2023 | 178.09 |
| September 30, 2023 | 173.20 |
| August 31, 2023 | 177.33 |
| July 31, 2023 | 168.58 |
| June 30, 2023 | 178.72 |
| May 31, 2023 | 204.49 |
| April 30, 2023 | 214.24 |
| March 31, 2023 | 224.88 |
| February 28, 2023 | 253.09 |
| January 31, 2023 | 318.94 |
| December 31, 2022 | 328.84 |
| November 30, 2022 | 340.11 |
| October 31, 2022 | 301.36 |
| September 30, 2022 | 283.92 |
| August 31, 2022 | 265.52 |
| July 31, 2022 | 286.36 |
| June 30, 2022 | 320.12 |
| May 31, 2022 | 347.82 |
| April 30, 2022 | 348.95 |
| March 31, 2022 | 331.22 |
| February 28, 2022 | 299.10 |
News
Headline
Time (ET)
05/22 07:41
05/13 17:00
05/12 15:51
Basic Info
|
Fertilizer Price Index is at a current level of 226.99, up from 189.38 last month and up from 166.09 one year ago. This is a change of 19.86% from last month and 36.67% from one year ago. |
| Report | IMF Primary Commodity Prices |
| Categories | Agriculture and Livestock , Chemicals , Metals |
| Region | N/A |
| Source | International Monetary Fund |
Stats
| Last Value | 226.99 |
| Latest Period | Mar 2026 |
| Last Updated | May 6 2026, 11:11 EDT |
| Next Release | Jun 3 2026, 08:00 EDT (E) |
| Average Growth Rate | 4.56% |
| Value from Last Month | 189.38 |
| Change from Last Month | 19.86% |
| Value from 1 Year Ago | 166.09 |
| Change from 1 Year Ago | 36.67% |
| Frequency | Monthly |
| Unit | Index 2016=100 |
| Adjustment | N/A |
| Download Source File | |
| Notes | Fertilizer Index, includes DAP, Potash, UREA |