

Exxon Mobil Corp (XOM) - Upstream Production (koebd) (I:EMCX6VYL)
Level Chart
Basic Info
|
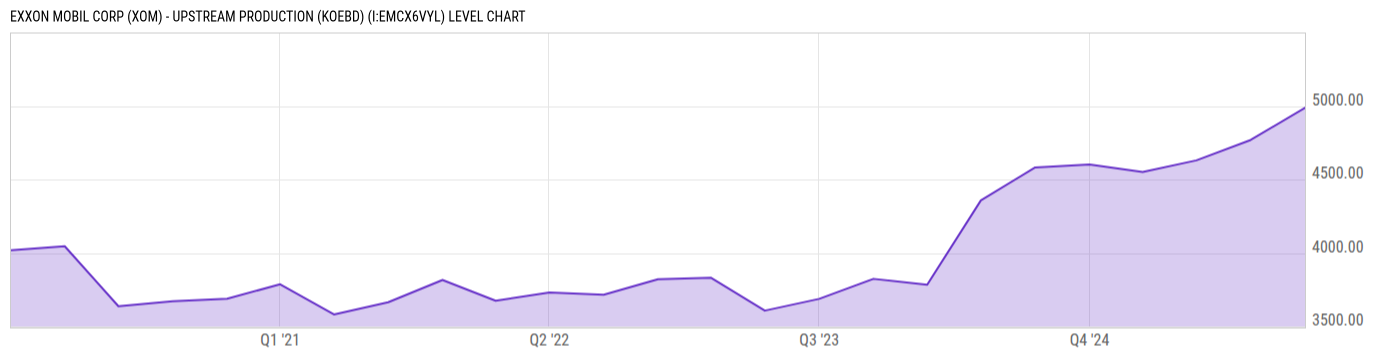
Exxon Mobil Corp (XOM) - Upstream Production (koebd) is at a current level of 4988.00, up from 4769.00 last quarter and up from 4602.00 one year ago. This is a change of 4.59% from last quarter and 8.39% from one year ago. |
|
Upstream Production (koebd) refers to the total upstream production volume of oil and natural gas in thousands of oil-equivalent barrels per day (koebd). |
| Report | Fiscal.ai |
| Category | Segments & KPIs |
| Region | United States |
| Source | Fiscal.ai |
|
Data provided via Fiscal.ai |
Stats
| Last Value | 4988.00 |
| Latest Period | Dec 2025 |
| Last Updated | Mar 23 2026, 14:09 EDT |
| Next Release | Jul 15 2026, 08:30 EDT (E) |
| Average Growth Rate | 4.04% |
| Value from Last Quarter | 4769.00 |
| Change from Last Quarter | 4.59% |
| Value from 1 Year Ago | 4602.00 |
| Change from 1 Year Ago | 8.39% |
| Frequency | Quarterly |
| Adjustment | N/A |
| Download Source File |
Historical Data
| Date | Value |
|---|---|
| December 31, 2025 | 4988.00 |
| September 30, 2025 | 4769.00 |
| June 30, 2025 | 4630.00 |
| March 31, 2025 | 4551.00 |
| December 31, 2024 | 4602.00 |
| September 30, 2024 | 4582.00 |
| June 30, 2024 | 4358.00 |
| March 31, 2024 | 3784.00 |
| December 31, 2023 | 3824.00 |
| September 30, 2023 | 3688.00 |
| June 30, 2023 | 3608.00 |
| March 31, 2023 | 3831.00 |
| December 31, 2022 | 3822.00 |
| Date | Value |
|---|---|
| September 30, 2022 | 3716.00 |
| June 30, 2022 | 3732.00 |
| March 31, 2022 | 3675.00 |
| December 31, 2021 | 3816.00 |
| September 30, 2021 | 3665.00 |
| June 30, 2021 | 3582.00 |
| March 31, 2021 | 3787.00 |
| December 31, 2020 | 3689.00 |
| September 30, 2020 | 3672.00 |
| June 30, 2020 | 3638.00 |
| March 31, 2020 | 4046.00 |
| December 31, 2019 | 4018.00 |
News
Basic Info
|
Exxon Mobil Corp (XOM) - Upstream Production (koebd) is at a current level of 4988.00, up from 4769.00 last quarter and up from 4602.00 one year ago. This is a change of 4.59% from last quarter and 8.39% from one year ago. |
|
Upstream Production (koebd) refers to the total upstream production volume of oil and natural gas in thousands of oil-equivalent barrels per day (koebd). |
| Report | Fiscal.ai |
| Category | Segments & KPIs |
| Region | United States |
| Source | Fiscal.ai |
|
Data provided via Fiscal.ai |
Stats
| Last Value | 4988.00 |
| Latest Period | Dec 2025 |
| Last Updated | Mar 23 2026, 14:09 EDT |
| Next Release | Jul 15 2026, 08:30 EDT (E) |
| Average Growth Rate | 4.04% |
| Value from Last Quarter | 4769.00 |
| Change from Last Quarter | 4.59% |
| Value from 1 Year Ago | 4602.00 |
| Change from 1 Year Ago | 8.39% |
| Frequency | Quarterly |
| Adjustment | N/A |
| Download Source File |