

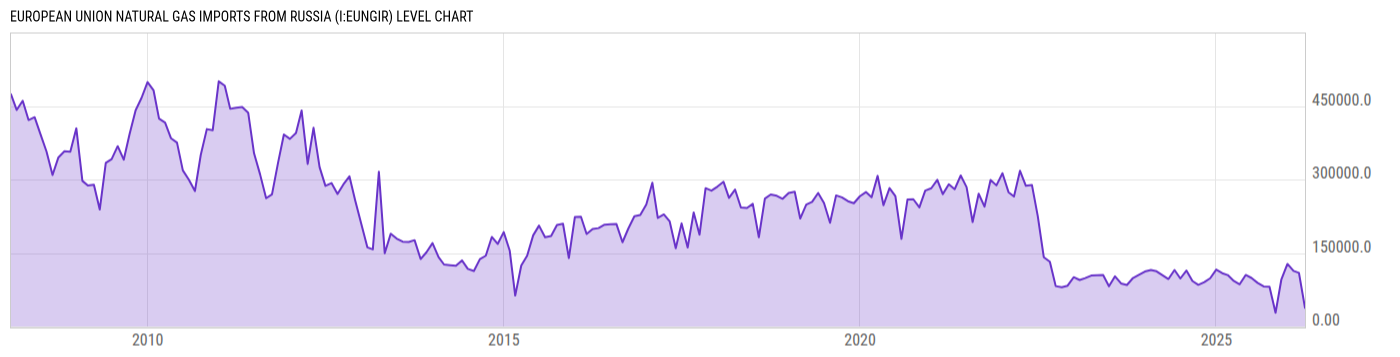
European Union Natural Gas Imports from Russia (I:EUNGIR)
38051.99 TJ for Mar 2026
Level Chart
Basic Info
|
European Union Natural Gas Imports from Russia is at a current level of 38051.99, down from 109446.7 last month and down from 92971.20 one year ago. This is a change of -65.23% from last month and -59.07% from one year ago. |
| Report | Europe Energy Statistics |
| Category | Energy |
Stats
| Last Value | 38051.99 |
| Latest Period | Mar 2026 |
| Last Updated | May 12 2026, 05:00 EDT |
| Next Release | Jun 12 2026, 05:00 EDT (E) |
| Average Growth Rate | 20.86% |
| Value from Last Month | 109446.7 |
| Change from Last Month | -65.23% |
| Value from 1 Year Ago | 92971.20 |
| Change from 1 Year Ago | -59.07% |
| Frequency | Monthly |
| Unit | Terajoule |
| Adjustment | N/A |
| Download Source File |
Historical Data
| Date | Value |
|---|---|
| March 31, 2026 | 38051.99 |
| February 28, 2026 | 109446.7 |
| January 31, 2026 | 113647.6 |
| December 31, 2025 | 127702.0 |
| November 30, 2025 | 96371.56 |
| October 31, 2025 | 27860.53 |
| September 30, 2025 | 81241.91 |
| August 31, 2025 | 81723.91 |
| July 31, 2025 | 89001.13 |
| June 30, 2025 | 98969.64 |
| May 31, 2025 | 105176.1 |
| April 30, 2025 | 86140.98 |
| March 31, 2025 | 92971.20 |
| February 28, 2025 | 104951.7 |
| January 31, 2025 | 108796.5 |
| December 31, 2024 | 116106.9 |
| November 30, 2024 | 98514.47 |
| October 31, 2024 | 90640.47 |
| September 30, 2024 | 85073.06 |
| August 31, 2024 | 92882.12 |
| July 31, 2024 | 114049.8 |
| June 30, 2024 | 97949.62 |
| May 31, 2024 | 115345.5 |
| April 30, 2024 | 96798.36 |
| March 31, 2024 |
| Date | Value |
|---|---|
| February 29, 2024 | 112596.0 |
| January 31, 2024 | 115179.4 |
| December 31, 2023 | 112127.2 |
| November 30, 2023 | 105242.7 |
| October 31, 2023 | 98918.87 |
| September 30, 2023 | 84742.78 |
| August 31, 2023 | 87805.76 |
| July 31, 2023 | 102417.7 |
| June 30, 2023 | 82038.57 |
| May 31, 2023 | 105108.0 |
| April 30, 2023 | 104701.9 |
| March 31, 2023 | 103924.5 |
| February 28, 2023 | 98660.01 |
| January 31, 2023 | 94867.88 |
| December 31, 2022 | 100577.5 |
| November 30, 2022 | 83269.21 |
| October 31, 2022 | 80225.14 |
| September 30, 2022 | 82392.27 |
| August 31, 2022 | 132007.9 |
| July 31, 2022 | 141253.6 |
| June 30, 2022 | 225223.0 |
| May 31, 2022 | 288967.6 |
| April 30, 2022 | 287048.4 |
| March 31, 2022 | 317713.0 |
| February 28, 2022 | 265229.3 |
News
Headline
Time (ET)
05/20 06:35
05/13 07:39
05/11 06:37
04/24 06:31
Basic Info
|
European Union Natural Gas Imports from Russia is at a current level of 38051.99, down from 109446.7 last month and down from 92971.20 one year ago. This is a change of -65.23% from last month and -59.07% from one year ago. |
| Report | Europe Energy Statistics |
| Category | Energy |
Stats
| Last Value | 38051.99 |
| Latest Period | Mar 2026 |
| Last Updated | May 12 2026, 05:00 EDT |
| Next Release | Jun 12 2026, 05:00 EDT (E) |
| Average Growth Rate | 20.86% |
| Value from Last Month | 109446.7 |
| Change from Last Month | -65.23% |
| Value from 1 Year Ago | 92971.20 |
| Change from 1 Year Ago | -59.07% |
| Frequency | Monthly |
| Unit | Terajoule |
| Adjustment | N/A |
| Download Source File |