

European Union Industrial Production Index MoM (I:EUCIPSM)
0.80% for Mar 2026
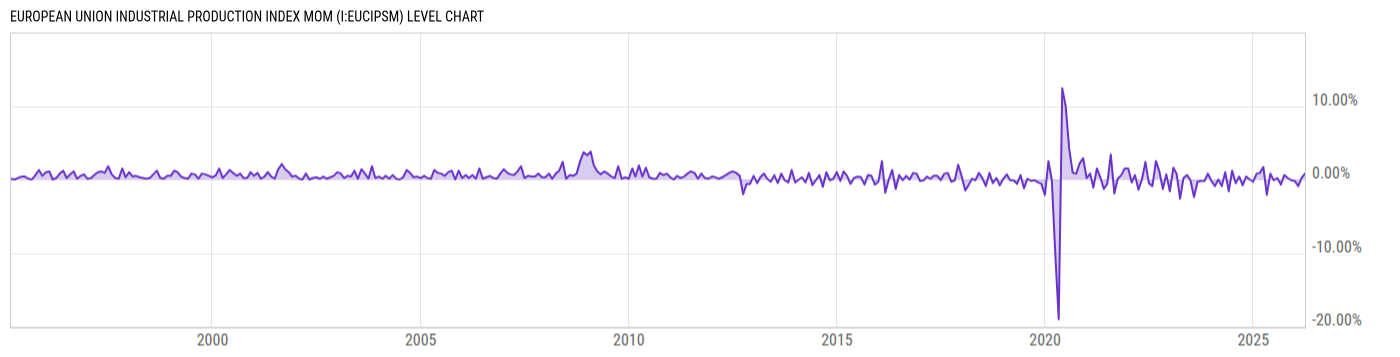
Level Chart
Basic Info
|
European Union Industrial Production Index MoM is at 0.80%, compared to 0.20% last month and 1.70% last year. This is higher than the long term average of 0.41%. |
| Report | European Industrial Production |
| Category | Manufacturing Statistics |
| Region | European Union |
| Source | Eurostat |
Stats
| Last Value | 0.80% |
| Latest Period | Mar 2026 |
| Last Updated | May 13 2026, 11:04 EDT |
| Next Release | Jun 15 2026, 11:00 EDT |
| Long Term Average | 0.41% |
| Average Growth Rate | 0.20% |
| Value from Last Month | 0.20% |
| Change from Last Month | 300.0% |
| Value from 1 Year Ago | 1.70% |
| Change from 1 Year Ago | -52.94% |
| Frequency | Monthly |
| Unit | Percent |
| Adjustment | Seasonally and Calendar Adjusted |
| Download Source File | |
| Notes | Mining and quarrying, manufacturing, electricity, gas, and steam and air conditioning supply |
Historical Data
| Date | Value |
|---|---|
| March 31, 2026 | 0.80% |
| February 28, 2026 | 0.20% |
| January 31, 2026 | -0.90% |
| December 31, 2025 | -0.20% |
| November 30, 2025 | -0.10% |
| October 31, 2025 | 0.20% |
| September 30, 2025 | 0.60% |
| August 31, 2025 | -0.70% |
| July 31, 2025 | 0.20% |
| June 30, 2025 | -0.10% |
| May 31, 2025 | 0.80% |
| April 30, 2025 | -2.10% |
| March 31, 2025 | 1.70% |
| February 28, 2025 | 0.90% |
| January 31, 2025 | 0.80% |
| December 31, 2024 | -0.30% |
| November 30, 2024 | 0.00% |
| October 31, 2024 | 0.40% |
| September 30, 2024 | -0.80% |
| August 31, 2024 | 0.40% |
| July 31, 2024 | -0.50% |
| June 30, 2024 | 1.20% |
| May 31, 2024 | -1.60% |
| April 30, 2024 | 1.00% |
| March 31, 2024 | -0.90% |
| Date | Value |
|---|---|
| February 29, 2024 | 0.00% |
| January 31, 2024 | -0.90% |
| December 31, 2023 | -0.20% |
| November 30, 2023 | 0.80% |
| October 31, 2023 | -0.20% |
| September 30, 2023 | -0.20% |
| August 31, 2023 | -0.30% |
| July 31, 2023 | -2.40% |
| June 30, 2023 | -0.10% |
| May 31, 2023 | 0.60% |
| April 30, 2023 | 0.20% |
| March 31, 2023 | -2.60% |
| February 28, 2023 | 0.80% |
| January 31, 2023 | 1.60% |
| December 31, 2022 | -1.60% |
| November 30, 2022 | 0.70% |
| October 31, 2022 | -1.30% |
| September 30, 2022 | 1.10% |
| August 31, 2022 | 2.50% |
| July 31, 2022 | -0.90% |
| June 30, 2022 | -0.50% |
| May 31, 2022 | 2.40% |
| April 30, 2022 | 0.00% |
| March 31, 2022 | -1.40% |
| February 28, 2022 | 0.60% |
News
Headline
Time (ET)
05/27 07:40
05/22 07:43
05/22 07:41
05/13 15:57
05/13 07:39
Basic Info
|
European Union Industrial Production Index MoM is at 0.80%, compared to 0.20% last month and 1.70% last year. This is higher than the long term average of 0.41%. |
| Report | European Industrial Production |
| Category | Manufacturing Statistics |
| Region | European Union |
| Source | Eurostat |
Stats
| Last Value | 0.80% |
| Latest Period | Mar 2026 |
| Last Updated | May 13 2026, 11:04 EDT |
| Next Release | Jun 15 2026, 11:00 EDT |
| Long Term Average | 0.41% |
| Average Growth Rate | 0.20% |
| Value from Last Month | 0.20% |
| Change from Last Month | 300.0% |
| Value from 1 Year Ago | 1.70% |
| Change from 1 Year Ago | -52.94% |
| Frequency | Monthly |
| Unit | Percent |
| Adjustment | Seasonally and Calendar Adjusted |
| Download Source File | |
| Notes | Mining and quarrying, manufacturing, electricity, gas, and steam and air conditioning supply |