

Eli Lilly & Co (LLY) - Oncology Revenue (I:ELCLFIMF)
Level Chart
Basic Info
|
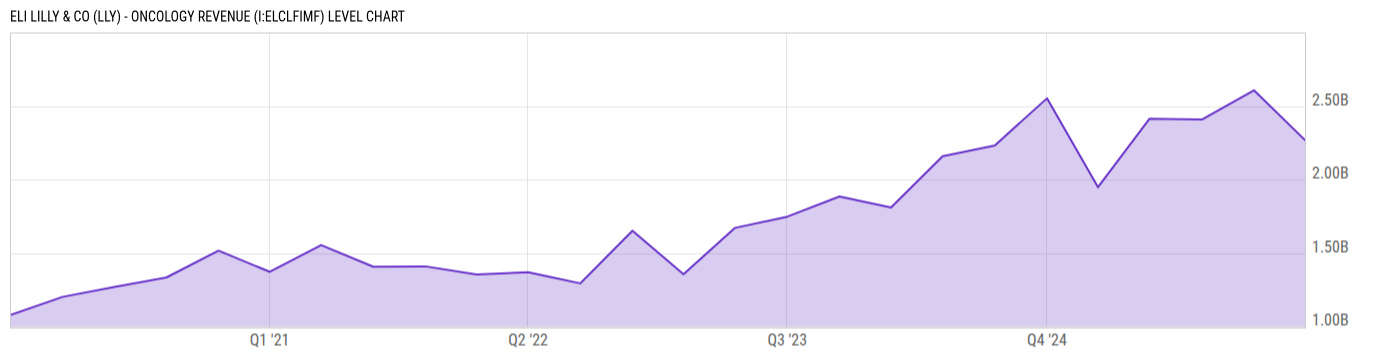
Eli Lilly & Co (LLY) - Oncology Revenue is at a current level of 2.268B, down from 2.607B last quarter and up from 1.948B one year ago. This is a change of -13.00% from last quarter and 16.46% from one year ago. |
|
Oncology Revenue refers to the total revenue generated by Eli Lilly & Co from its products and treatments related to oncology within a specific reporting period. |
| Report | Fiscal.ai |
| Category | Segments & KPIs |
| Region | United States |
| Source | Fiscal.ai |
|
Data provided via Fiscal.ai |
Stats
| Last Value | 2.268B |
| Latest Period | Mar 2026 |
| Last Updated | May 15 2026, 08:33 EDT |
| Next Release | Aug 5 2026, 08:30 EDT (E) |
| Average Growth Rate | 15.29% |
| Value from Last Quarter | 2.607B |
| Change from Last Quarter | -13.00% |
| Value from 1 Year Ago | 1.948B |
| Change from 1 Year Ago | 16.46% |
| Frequency | Quarterly |
| Unit | USD |
| Adjustment | N/A |
| Download Source File |
Historical Data
| Date | Value |
|---|---|
| March 31, 2026 | 2.268B |
| December 31, 2025 | 2.607B |
| September 30, 2025 | 2.408B |
| June 30, 2025 | 2.414B |
| March 31, 2025 | 1.948B |
| December 31, 2024 | 2.552B |
| September 30, 2024 | 2.232B |
| June 30, 2024 | 2.159B |
| March 31, 2024 | 1.81B |
| December 31, 2023 | 1.884B |
| September 30, 2023 | 1.747B |
| June 30, 2023 | 1.671B |
| March 31, 2023 | 1.356B |
| Date | Value |
|---|---|
| December 31, 2022 | 1.651B |
| September 30, 2022 | 1.293B |
| June 30, 2022 | 1.369B |
| March 31, 2022 | 1.353B |
| December 31, 2021 | 1.409B |
| September 30, 2021 | 1.406B |
| June 30, 2021 | 1.554B |
| March 31, 2021 | 1.372B |
| December 31, 2020 | 1.516B |
| September 30, 2020 | 1.333B |
| June 30, 2020 | 1.269B |
| March 31, 2020 | 1.202B |
| December 31, 2019 | 1.080B |
News
Basic Info
|
Eli Lilly & Co (LLY) - Oncology Revenue is at a current level of 2.268B, down from 2.607B last quarter and up from 1.948B one year ago. This is a change of -13.00% from last quarter and 16.46% from one year ago. |
|
Oncology Revenue refers to the total revenue generated by Eli Lilly & Co from its products and treatments related to oncology within a specific reporting period. |
| Report | Fiscal.ai |
| Category | Segments & KPIs |
| Region | United States |
| Source | Fiscal.ai |
|
Data provided via Fiscal.ai |
Stats
| Last Value | 2.268B |
| Latest Period | Mar 2026 |
| Last Updated | May 15 2026, 08:33 EDT |
| Next Release | Aug 5 2026, 08:30 EDT (E) |
| Average Growth Rate | 15.29% |
| Value from Last Quarter | 2.607B |
| Change from Last Quarter | -13.00% |
| Value from 1 Year Ago | 1.948B |
| Change from 1 Year Ago | 16.46% |
| Frequency | Quarterly |
| Unit | USD |
| Adjustment | N/A |
| Download Source File |