

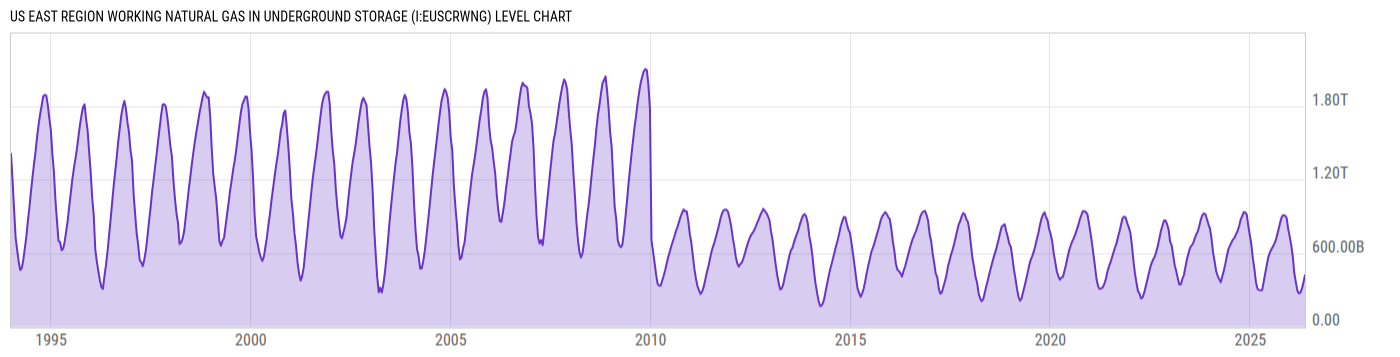
US East Region Working Natural Gas in Underground Storage (I:EUSCRWNG)
419.00B cf for Wk of May 15 2026
Level Chart
Basic Info
|
US East Region Working Natural Gas in Underground Storage is at a current level of 419.00B, up from 388.00B last week and up from 396.00B one year ago. This is a change of 7.99% from last week and 5.81% from one year ago. |
| Report | Weekly Natural Gas Storage |
| Category | Energy |
| Region | United States |
| Source | Energy Information Administration |
Stats
| Last Value | 419.00B |
| Latest Period | May 15 2026 |
| Last Updated | May 21 2026, 10:31 EDT |
| Next Release | May 28 2026, 10:30 EDT |
| Average Growth Rate | 5.96% |
| Value from Last Week | 388.00B |
| Change from Last Week | 7.99% |
| Value from 1 Year Ago | 396.00B |
| Change from 1 Year Ago | 5.81% |
| Frequency | Weekly |
| Unit | Cubic Feet |
| Adjustment | N/A |
| Download Source File | |
| Notes | For the Eastern Consuming region which is composed of Connecticut, Delaware, District of Columbia, Florida, Georgia, Iowa, Illinois, Indiana, Kentucky, Massachusetts, Maryland, Maine, Michigan, Missouri, North Carolina, Nebraska, New Hampshire, New Jersey, New York, Ohio, Pennsylvania, Rhode Island, South Carolina, Tennessee, Vermont, Virginia, Wisconsin, and West Virginia. |
Historical Data
| Date | Value |
|---|---|
| May 15, 2026 | 419.00B |
| May 08, 2026 | 388.00B |
| May 01, 2026 | 361.00B |
| April 24, 2026 | 332.00B |
| April 17, 2026 | 309.00B |
| April 10, 2026 | 283.00B |
| April 03, 2026 | 277.00B |
| March 27, 2026 | 270.00B |
| March 20, 2026 | 271.00B |
| March 13, 2026 | 302.00B |
| March 06, 2026 | 294.00B |
| February 27, 2026 | 322.00B |
| February 20, 2026 | 364.00B |
| February 13, 2026 | 388.00B |
| February 06, 2026 | 437.00B |
| January 30, 2026 | 503.00B |
| January 23, 2026 | 577.00B |
| January 16, 2026 | 632.00B |
| January 09, 2026 | 664.00B |
| January 02, 2026 | 697.00B |
| December 26, 2025 | 736.00B |
| December 19, 2025 | 751.00B |
| December 12, 2025 | 797.00B |
| December 05, 2025 | 843.00B |
| November 28, 2025 | 888.00B |
| Date | Value |
|---|---|
| November 21, 2025 | 892.00B |
| November 14, 2025 | 905.00B |
| November 07, 2025 | 914.00B |
| October 31, 2025 | 909.00B |
| October 24, 2025 | 913.00B |
| October 17, 2025 | 899.00B |
| October 10, 2025 | 883.00B |
| October 03, 2025 | 860.00B |
| September 26, 2025 | 832.00B |
| September 19, 2025 | 807.00B |
| September 12, 2025 | 781.00B |
| September 05, 2025 | 757.00B |
| August 29, 2025 | 735.00B |
| August 22, 2025 | 707.00B |
| August 15, 2025 | 690.00B |
| August 08, 2025 | 677.00B |
| August 01, 2025 | 656.00B |
| July 25, 2025 | 651.00B |
| July 18, 2025 | 634.00B |
| July 11, 2025 | 628.00B |
| July 04, 2025 | 616.00B |
| June 27, 2025 | 602.00B |
| June 20, 2025 | 589.00B |
| June 13, 2025 | 563.00B |
| June 06, 2025 | 531.00B |
News
Headline
Time (ET)
05/22 06:05
05/21 09:30
05/15 06:06
05/07 09:33
Basic Info
|
US East Region Working Natural Gas in Underground Storage is at a current level of 419.00B, up from 388.00B last week and up from 396.00B one year ago. This is a change of 7.99% from last week and 5.81% from one year ago. |
| Report | Weekly Natural Gas Storage |
| Category | Energy |
| Region | United States |
| Source | Energy Information Administration |
Stats
| Last Value | 419.00B |
| Latest Period | May 15 2026 |
| Last Updated | May 21 2026, 10:31 EDT |
| Next Release | May 28 2026, 10:30 EDT |
| Average Growth Rate | 5.96% |
| Value from Last Week | 388.00B |
| Change from Last Week | 7.99% |
| Value from 1 Year Ago | 396.00B |
| Change from 1 Year Ago | 5.81% |
| Frequency | Weekly |
| Unit | Cubic Feet |
| Adjustment | N/A |
| Download Source File | |
| Notes | For the Eastern Consuming region which is composed of Connecticut, Delaware, District of Columbia, Florida, Georgia, Iowa, Illinois, Indiana, Kentucky, Massachusetts, Maryland, Maine, Michigan, Missouri, North Carolina, Nebraska, New Hampshire, New Jersey, New York, Ohio, Pennsylvania, Rhode Island, South Carolina, Tennessee, Vermont, Virginia, Wisconsin, and West Virginia. |